InFLUENCE of perceived service
quality on patient satisfaction
in an Ecuadorian healthcare center
Samuel Alberto Barrera-Cercado
https://orcid.org/0009-0000-1929-3075
ESPOL Polytechnic University, ESPOL, Guayaquil, Ecuador
Damaris Samantha Celdo-Crespo
https://orcid.org/0009-0003-8578-3672
ESPOL Polytechnic University, ESPOL, Guayaquil, Ecuador
Ronald Campoverde-Aguirre
https://orcid.org/0000-0003-2759-469X
ESPOL Polytechnic University, ESPOL, Guayaquil, Ecuador
Danny Arévalo-Avecillas
https://orcid.org/0009-0004-7161-1113
ESPOL Polytechnic University, ESPOL, Guayaquil, Ecuador
Rober Luciano Alipio
https://orcid.org/0000-0001-9555-6690
University of Tarma, Peru
Victor Hugo González Jaramillo
https://orcid.org/0000-0002-2443-5397
ESPOL Polytechnic University, ESPOL, Guayaquil, Ecuador
Received: May 30, 2026 / Accepted: June 5, 2026
doi: https://doi.org/10.26439/ddee2026.n009.8926
ABSTRACT. Citizens are becoming increasingly informed, leading to heightened expectations regarding the services they receive, particularly in healthcare, where they seek high-quality care and high levels of satisfaction. This study aims to analyze the impact of service quality on patient satisfaction in a medical center in Ecuador. This study employs a quantum approach, utilizing a cross-sectional and non-experimental design with an explanatory scope. It measures five dimensions encompassing both objective and subjective quality through the SERVQHOS model. Data were collected from 276 users of health services, including both virtual and face-to-face interactions, and participants were categorized into two groups: those with health insurance and those without. The researchers processed data using SPSS alongside a structural model. The primary findings indicate that responsiveness, empathy, and reliability significantly influence customer satisfaction, which over time increases the likelihood of service recommendations and repeat patronage. Contemporary health service users seek higher quality; therefore, health centers must implement strategies that foster customer satisfaction, ultimately achieving sustained market positioning and viability.
KEYWORDS: perceived service quality / patient satisfaction / impact / case study / private medical center
Influencia de la calidad de servicio percibida
en la satisfacción del paciente en un centro médico ecuatoriano
RESUMEN. El ciudadano está cada vez más informado, por lo tanto, es más exigente con los servicios que recibe, como es el caso de la salud, sector en el que busca servicios de calidad y, en función de ello, demuestra satisfacción. Para el estudio, el objetivo fue realizar un análisis del impacto de la calidad de los servicios en la satisfacción del cliente en un centro médico de Ecuador. Se siguió lo propuesto por el enfoque cuantitativo, diseño transversal y no experimental, con un alcance explicativo. Se midieron cinco dimensiones que incluyen calidad objetiva y subjetiva mediante el modelo SERVQHOS. Los datos obtenidos fueron recopilados de 276 usuarios de servicios de salud, tanto virtuales como presenciales. Para el estudio, se agruparon en dos tipos de usuarios: quienes contaban con seguro médico y quienes no lo tenían. El procesamiento de datos se realizó mediante SPSS, además del modelo estructural. Entre los principales resultados, tanto la capacidad de respuesta, la empatía y la fiabilidad muestran un impacto significativo en la satisfacción, lo que a largo plazo conduce a poder recomendar el servicio o a la recompra por parte de los propios clientes. Los usuarios de servicios de salud hoy en día buscan servicios de mayor calidad, por lo que los centros de salud deben establecer estrategias que les permitan obtener clientes satisfechos, de manera que logren posicionamiento y sostenibilidad en el tiempo.
PALABRAS CLAVE: calidad de servicio percibida / satisfacción del paciente / impacto / estudio de caso / centro médico privado
This is an open-access article distributed under the terms of the Creative Commons Attribution 4.0 International License (C BY 4.0).
INTRODUCTION
The SARS-COV-2 pandemic significantly impacted healthcare systems worldwide (Jabs et al., 2022). The Ecuadorian public healthcare system was no exception, as the coronavirus exposed deficiencies in both the hospital and outpatient care necessary to address health crises effectively (Ahen, 2022). The pandemic’s effects were evident in daily mortality rates and the occupancy levels within the healthcare system (Guevara-Rosero, 2023). In 2020, deaths attributed to both identified and unidentified Covid-19 cases accounted for 20.6% of total deaths across the country, totaling 23,921 fatalities (Instituto Nacional de Estadística y Censos [INEC], 2022a). In the city of Guayaquil alone, there were 5,083 deaths from identified and unidentified coronaviruses in 2020, with the peak occurring in April, which recorded 2,304 deaths (INEC, 2020). Additionally, in July of 2020, the occupancy rate for operational intensive care beds due to coronavirus was 88% (Ministerio de Salud Pública del Ecuador, 2020).
In response to the ongoing health crisis, the National Government increased the number of hospital beds, the training of doctors, and the availability of COVID-19 tests within the health system. However, in certain public hospitals, care was denied to patients without COVID-19. This occurred as the Government sought to prevent the spread of the disease among uninfected individuals, inadvertently forcing many patients with other ailments to seek treatment at private medical centers (Quintuña Velecela, 2021). Globally, demand for medical services has increased significantly, and this upward trend is projected to continue over the next four years (Wu & Ho, 2023). In Ecuador, the use of life insurance and prepaid medical care services rose by 71% compared to 2019 (Federación Ecuatoriana de Seguros, 2022). Furthermore, industry expectations indicate an average growth in demand of 6.45% globally and 4.9% specifically for Latin America in 2022.
The increasing demand for private medical services in Ecuador has prompted more companies to enter the market to provide healthcare services (Coral-Almeida et al., 2022). The Medical Services Quality Assurance Agency reports that between February and December 2020, the issuance of operating permits in Zone 8, which includes the cantons of Guayaquil, Durán, and Samborondón, grew by 36.94% (Ortiz-Culcay et al., 2022). Furthermore, data from INEC (2022b) indicates that Ecuador has 2.32 doctors per thousand inhabitants, whereas the WHO recommends 1.8 doctors per thousand, focusing solely on general medical services. As a result of having more doctors than the country requires and the scarcity of available medical positions, many doctors decide to pursue private practice. This decision leads them to establish their own private practices, so they become potential competition for existing private medical centers (Mosquera, 2017).
In the healthcare sector, perceptions of service quality play a fundamental role in determining patient satisfaction (Karaca & Durna, 2019). As patients increasingly seek personalized care and exceptional experiences, private medical centers are focusing more on providing high-quality services (Tan et al., 2019). Understanding the impact of perceived service quality on patient satisfaction within such facilities is crucial for enhancing healthcare experiences and optimizing healthcare outcomes.
One example of a private healthcare provider is MEDISUR, an outpatient medical care center operating in the city of Guayaquil. It has been operating for 14 years and employs more than 100 healthcare professionals. Alongside 25 other companies, MEDISUR faced an increase in patient volume during the pandemic. The center operates three branches across the city -- one in the north and two in the south -- and aims to enhance its aggregate product while improving its competitiveness in the Guayaquil market. To achieve this, MEDISUR has developed an action plan centered on three key strategies: redefining the target market through market research and segmenting based on socioeconomic, demographic, and behavioral variables to modify the current value proposition and reevaluate the company’s strategic direction; restructuring and redefining operational marketing strategies, including pricing policy, service delivery, communication, and promotion, guided by insights gained from the target market; and evaluating the actual impact of the current value proposition and comparing it to the expected impact to identify process improvements and achieve higher levels of customer loyalty. Between January 1 and June 22, 2022, MEDISUR attended to 6,049 patients seven days a week. On business days (Monday to Friday), the centers operate for 12 hours, while on Saturdays, they are open for 9 hours; and on Sundays, for 4 hours. Based on this schedule, the distribution of patients per average hour is detailed in Table 1.
Considering this context, the present investigation aims to evaluate the impact of service quality on patient satisfaction at the MEDISUR private medical center in Guayaquil. This evaluation will utilize the SERVQHOS instrument across various patient demographics to identify the factors that influence customer satisfaction, thereby facilitating improvements in patient loyalty. Additionally, it is essential to explore whether differences exist in service quality and satisfaction levels between patients with medical insurance and those who self-pay.
THEORETICAL FRAMEWORK
Quality of Service
Numerous authors have examined the concept of quality from various perspectives. Walter Shewhart (1997) argues that quality arises from the interaction between a subjective component and a productive component as perceived by the client or user (Masterson et al., 2022). The subjective component encompasses the desires and expectations of the client or user regarding a product, while the productive component reflects how organizations propose to fulfill those desires or needs (Li et al., 2020). Consequently, organizations aim to minimize the disparity between the value expected by users and the value delivered (Athey et al., 2023). A larger gap results in increased rejection of products by consumers, potentially leading to significant financial losses that can impact both society and the producing organization (Van Barneveld et al., 2020).
Another perspective on quality is that of the International Organization for Standardization (ISO, 2015) as outlined in its ISO 9000:2015 standard that quality encompasses the totality of characteristics or attributes that an entity-- be it a product, service, process, institution, system or individual--possesses, enabling it to meet clearly defined and established requirements. As a result, every product, process, system, and organization can be assessed to compare expectations with the actual conditions in which they exist (Adner, 2006). In the context of the health sector, Donabedian (1980) established that quality arises from medical care, in which the patient perceives an improvement in well-being following a process characterized by gains and losses in the care experience. This enhancement may manifest in improved patient recovery and satisfaction.
One of the compelling arguments supporting this definition, which has been extensively used in various studies, is that within the field of medicine, it is unacceptable to permit any percentage of quality loss, as may occur in manufacturing or the service sector (Crosby, 1992). Even the slightest deterioration in the quality of medical care can jeopardize a patient’s life. Therefore, rather than focusing solely on the loss of quality in medical care as the primary detriment to patients, researchers analyze the risks associated with a patient’s health worsening or facing mortality due to substandard care (Jiménez Paneque, 2004).
Given that the evaluation of quality in the healthcare system fundamentally differs from the assessment methods employed in the production of goods and services, the National Health System Digital (2020) of the United Kingdom published the “Framework for the Evaluation in Performance,” which establishes metrics tailored specifically for the healthcare sector to quantitatively measure quality. These metrics include: the improvement in a patient’s health following the treatment provided by healthcare professionals, equity in access to the healthcare system, effective delivery of appropriate care as experienced by patients and caregivers, efficiency in care, and health outcomes within the system.
Quality Assessment Models in Medical Services
Metrics that relate directly or indirectly to the quality of medical care are crucial for assessment (Greenhalgh et al., 2009). SERVQHOS stands out as one of the most widely used instruments in the hospital care sector for evaluating the quality perceived by clients (Ortiz, 2016). This tool is derived from adapting the SERVQUAL service quality model developed by Parasuraman et al. (1988) to the healthcare context. Its methodological validity, which enables the evaluation of the cognitive construct of quality through patient expectations, has established it as one of the most frequently employed tools in the service sector. Furthermore, SERVQHOS demonstrates high internal consistency, strong predictive capability, and a solid factorial structure (Mira et al., 1998).
The instrument comprises two factors. The first, termed subjective quality, encompasses aspects that are inherently subjective and challenging to assess externally, as they hinge on the patient’s perceptions of the medical center and its staff, including empathy, safety, and reliability. In contrast, the second factor, objective quality, pertains to aspects that can be verified and measured. These include the medical center’s responsiveness and tangible elements such as infrastructure, cleanliness, technology, and signage, among others.
Service Satisfaction
Unlike quality, the conceptualization of satisfaction is inherently practical, as much of its meaning emerges as a response— as a behavior, feeling, or thought—prior to the individual’s interaction with a stimulus in their environment. This interpretation develops, within a specific context, in a manner that can be either positive or negative over time (Giese & Cote, 2000). Initial studies by Czepiel and Rosenberg (1977) and by Oliver (1980) regarded satisfaction as a definitive psychological state that is triggered during the purchase of a product. This state allows individuals to experience a sense of achievement or happiness when the attributes of the purchased product meet or exceed their expectations (Oliver & Swan, 1989). Conversely, If this cognitive process evokes negative emotions regarding the product attributes or the shopping experience, a condition known as dissatisfaction may arise (Westbrook & Reilly, 1983).
There exists a direct relationship between the concepts of satisfaction and dissatisfaction, suggesting that one may depend on the other. Nevertheless, these two concepts are cognitively distinct and may operate independently, depending on the context. An individual can experience both satisfaction and dissatisfaction simultaneously in response to a given stimulus, such as a product or service (Mora Contreras, 2011). This duality arises because consumers or users establish subjective measurement criteria for the products they engage with, taking into account not only the product’s functional benefits and attributes but also the overall experience associated with it (Oliver, 1997).
Individual satisfaction is regarded as one of the most significant outcomes associated with the delivery of high-quality medical services. Consequently, patient satisfaction or dissatisfaction emerges as a response to a positive evaluation of the quality of the services provided. Blanco and Rivero (2009) identify several key factors influencing customer satisfaction with the services rendered, including the training of employees to effectively address all patient inquiries, the demonstration of kindness and courtesy, the establishment of a high level of trust, and the impression that employees genuinely dedicate their time to resolving patients’ concerns.
Relationship Between Service Quality and Satisfaction
Although satisfaction and quality have been defined separately, it is essential to recognize their interrelationship in the service sector, as the value proposition can positively influence customer loyalty to organizations (Masuet, 2010). If either concept is lacking in the medical care provided, two contrasting scenarios may arise. On the one hand, patients may experience a lack of resolution for their health issues, potentially endangering their lives, yet still feel satisfied with the medical attention they received. On the other hand, there may be patients whose doctors successfully treated their illnesses, but who express dissatisfaction with the quality of care provided (Ortiz, 2016).
Thompson and Suñol (1995) assert that individual satisfaction can be measured by users’ expectations regarding a specific product or service. Consequently, for users to perceive positive quality when a service is provided, they must recognize that the value received exceeds their initial expectations. While authors may differ in their perspectives on the relationship between satisfaction and quality, it is reasonable to conclude that the quality perceived by a patient can be quantified by analyzing the discrepancy between the service delivered and the user’s expectations. Furthermore, measuring satisfaction serves as the metric that facilitates the analysis of this gap.
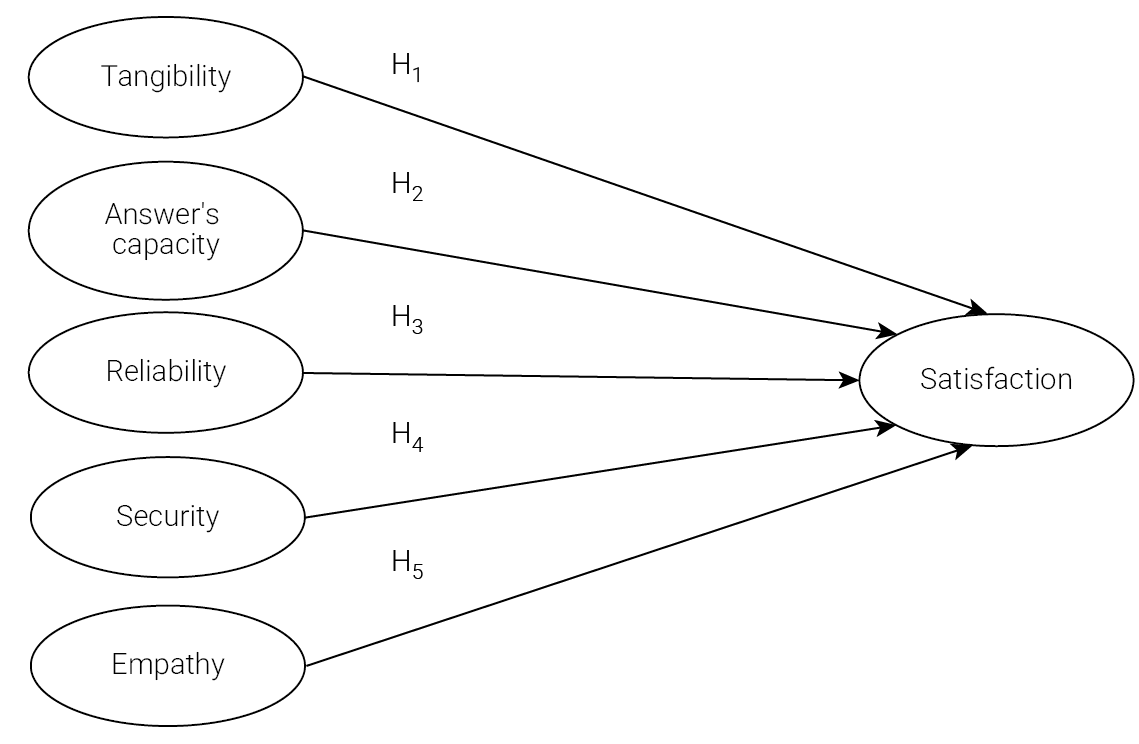
Based on the revised concepts and the theoretical model presented in Figure 1, we formulate the following hypotheses:
H1 The Reliability dimension positively and significantly influences the overall satisfaction of patients at the medical center.
H2: The Safety dimension exerts a positive and significant effect on the overall satisfaction of patients at the medical center.
H3: The Tangible Elements dimension positively and significantly influences the overall satisfaction of patients at the medical center.
H4: The Empathy dimension positively and significantly impacts the overall satisfaction of patients at the medical center.
H5: The Response Capacity dimension has a positive and significant influence on the overall satisfaction of patients at the medical center (Figure 1).
Figure 1
Conceptual framework of the investigative study
METHODOLOGY
Population and Sample
For this research, the study population consists of 6,049 patients who received treatment at the medical center between January and June 2022 (Table 1).
Table 1
Patient Attendence Metrics: Hourly, Daily, and Monthly Analysis
|
|
January |
February |
March |
April |
May |
June |
|
Monday |
12 |
3.8 |
6.1 |
5.8 |
4.1 |
5.3 |
|
Tuesday |
12 |
5 |
4.4 |
4.8 |
4.5 |
4 |
|
Wednesday |
12 |
5 |
5.2 |
5.8 |
4.5 |
5.4 |
|
Thursday |
11 |
5.1 |
6.2 |
5 |
4.8 |
5.5 |
|
Friday |
7.8 |
4.1 |
5.1 |
3.8 |
4.1 |
4.4 |
|
Saturday |
9.8 |
5.2 |
5.8 |
4.5 |
4.8 |
4.2 |
|
Sunday |
8.7 |
3.2 |
2.8 |
3.8 |
2.4 |
3.1 |
Note. Data from January 1 to June 22, 2022. MEDISUR.
Data were collected through non-probabilistic convenience sampling, as the information obtained from patients was entirely dependent on their willingness to respond to the administered survey (Malhotra, 2019). A total of 325 patients from the medical center participated in the survey, constituting a sample size deemed appropriate for the analytical technique employed.
Measuring Instruments
In evaluating medical care, researchers have implemented several instruments that are directly or indirectly related to the quality of service provided. This study employs the Service Quality for Hospitals (SERVQHOS) instrument due to its flexibility, scalability, and ease of measurement. The short version of the instrument, which consists of 19 items, is organized into two sections. The first section, addressing objective quality, comprises two dimensions: Tangible Elements and Response Capacity. The second section, focusing on subjective quality, is made up of three dimensions: Empathy, Security, and Reliability (see Table 2). Respondents evaluate the items using a 5-point Likert scale that captures the disparity between expectations and actual service delivery, where a score of 1 indicates the service was worse than expected, and a score of 5 indicates the service exceeded expectations (Torres & Vásquez, 2015).
Table 2
SERVQHOS Questionnaire Items
|
Quality |
Dimension |
Item |
|
Objective quality |
Tangible elements |
Infrastructure comfort |
|
Biomedical technology |
||
|
Signaling |
||
|
Ease of getting to the place |
||
|
Response capacity |
Punctuality in the medical appointment |
|
|
Wait time |
||
|
Speed in attention |
||
|
Subjective quality |
Empathy |
Interest nurses |
|
Staff friendliness |
||
|
Personalized |
||
|
Interest in solving problems |
||
|
Security |
Trust and security |
|
|
Staff preparation |
||
|
Understand patient needs |
||
|
Staff appearance |
||
|
Reliability |
Fulfill what is promised |
|
|
Willingness to help |
||
|
Information to relatives |
||
|
Information to the patient |
Additionally, four items were designed to assess users’ overall satisfaction, likelihood of returning to the medical center, willingness to recommend the medical service, and perceptions of service improvement, evaluated on a 5-point Likert scale. Furthermore, eight questions were crafted to establish the respondent’s profile, including age, sex, area of residence, frequency of visits to the medical center, the specific service accessed, whether the respondent attended alone or accompanied, and the type of patient status (insured or uninsured).
Data Collection and Analysis
Data collection occurred between July 24 and August 7, 2022 utilizing a questionnaire developed in Microsoft Forms. This questionnaire was distributed to patients of the medical center in-person, online, or by telephone. To conduct the descriptive analysis and confirmatory factor analysis, we used statistical software called SPSS version 27.0. For the development of the structural equation model (SEM), we used SmartPLS Software version 3.3 to analyze heterogeneity, segmenting the data by the variable “type of patient.”
Prior to performing the confirmatory factor analysis, we conducted a KMO test, which yielded a result of 0.645. Additionally, Barrett’s sphericity test yielded a chi-square statistic with a p-value less than 0.05, thus satisfying the criterion for factor analysis. The analysis was undertaken using the unweighted least squares method to mitigate convergence issues associated with alternative methods such as maximum likelihood (Olivares et al., 2017). In our model, the five factors account for 85.81% of the variance.
RESULTS
Sample Characteristics
A total of 276 valid surveys were completed, resulting in a response rate of 84.92%. Among the respondents, 66.30% (183) identified as male, while 33.70% (93) identified as female. Notably, 50% of the participants are under 25 years of age, and 75% are under 33 years of age. Concerning residence, 38.4% (n=106) reside north of the city or in neighboring towns, 33.7% (n=93) live south of the city, and the remaining 27.9% (n=77) live in the city center or in areas outside the city.
In terms of the medical specialties, 69.20% (n=191) of patients received care from general medicine practitioners, while the remaining patients were treated by specialists in Obstetrics (16.3%), Urology (5.8%), Traumatology (7.6%), and Laboratory and Cardiology (1.1%). Among all participants surveyed, 67.76% reported that they typically schedule their medical appointments in person, whereas 32.24% utilize digital channels such as websites or social media networks for this purpose.
Segmentation Information
The survey results identify two primary motivations for patients visiting the medical center. A notable 59.78% of respondents (n=165) cited a preference for the competitive pricing offered, while 31.88% (n=88) indicated that their visit was influenced by having a clinical history registered with MEDISUR. The remaining 8.34% (n=23) reported visiting the center either to use their health insurance or because of its proximity to their residences.
In terms of attendance frequency, patients’ visits to the medical center fell into three categorized levels: High, defined as visiting between 5 and 6 times per semester, Medium, for those attending 3 to 4 times per semester), and Low, for patients who visit 1 to 2 times, or are first-time attendees. , Specifically, 60.18% of respondents reported visiting the medical center 1 to 2 times, 23.80% attended 3 to 4 times, and 16.02% consulted the center routinely, visiting 5 to 6 times per semester.
Regarding patient demographics, 39.49% (n=109) of respondents have private health insurance, while 60.51% (n=167) do not have such coverage.
Confirmatory Factor Analysis
To establish a high level of reliability in the results, we evaluated each SERVQHOS item using Cronbach’s Alpha. A score above 0.7 on a scale from 0 to 1 indicates a high degree of confidence (Chión & Charles, 2016). In this instance, the overall reliability of the model is affirmed, with an α of 0.937 (Table 3 and Table 4).
Table 3
Confirmatory Factor Analysis of SERVQHOS Dimensions by Client Group
|
Cluster Dimensions |
Own Resources |
Indirect Payment |
||||
|
Factorial Loads |
Alpha Cronbach |
Explained Variance |
Factorial Loads |
Alpha Cronbach |
Explained Variance |
|
|
Tangible elements |
0.694 |
0.725 |
0.694 |
0.858 |
||
|
TE_1 |
0.576 |
0.597 |
||||
|
TE_2 |
0.719 |
0.901 |
||||
|
TE_3 |
0.737 |
0.881 |
||||
|
TE_4 |
0.791 |
0.864 |
||||
|
Reliability |
0.659 |
0.860 |
0.756 |
0.842 |
||
|
R_1 |
0.763 |
0.667 |
||||
|
R_2 |
0.691 |
0.887 |
||||
|
R_3 |
0.687 |
0.838 |
||||
|
R_4 |
0.683 |
0.788 |
||||
|
Cluster Dimensions |
Own Resources |
Indirect Payment |
||||
|
Factorial Loads |
Alpha Cronbach |
Explained Variance |
Factorial Loads |
Alpha Cronbach |
Explained Variance |
|
|
Empathy |
0.676 |
0.919 |
0.842 |
0.833 |
||
|
E_1 |
0.595 |
0.917 |
||||
|
E_2 |
0.676 |
0.881 |
||||
|
E_3 |
0.793 |
0.568 |
||||
|
E_4 |
0.763 |
0.561 |
||||
|
Ability answer |
0.834 |
0.883 |
0.866 |
0.8695 |
||
|
AA_1 |
0.792 |
0.663 |
||||
|
AA_2 |
0.734 |
0.763 |
||||
|
AA_3 |
0.745 |
0.653 |
||||
|
Security |
0.687 |
0.692 |
0.709 |
0.8387 |
||
|
S_1 |
0.641 |
0.778 |
||||
|
S_2 |
0.636 |
0.597 |
||||
|
S_3 |
0.549 |
0.776 |
||||
|
S_4 |
0.607 |
0.835 |
||||
Note. KMO test: .645.
Table 4
Confirmatory Factor Analysis of Patient Satisfaction Across Different Groups
|
Cluster |
Own Resources |
Indirect Payment |
||||
|
Factorial Loads |
Alpha Cronbach |
Explained Variance |
Factorial Loads |
Alpha Cronbach |
Explained Variance |
|
|
Satisfaction |
0.746 |
0.9439 |
0.724 |
0.9361 |
||
|
ST _1 |
0.749 |
0.651 |
||||
|
ST _2 |
0.879 |
0.828 |
||||
|
ST _3 |
0.892 |
0.872 |
||||
|
ST _4 |
0.450 |
0.665 |
||||
Note. KMO test: .607.
The factorial analysis involved segmenting patients into two groups: those without health insurance and those with either their own health insurance or someone else’s The study demonstrates convergent validity, as indicated by an average variance extracted exceeding 0.5 and the Cronbach’s Alpha values above 0.65, as presented in Table 4 (Becker et al., 2018). Furthermore, the confirmatory factor analysis of the satisfaction questions, categorized by payment type, reaffirmed the convergent validity of the items using the average variance extracted and Cronbach’s Alpha. Additionally, the KMO test yielded a value of .607 and Barrett’s sphericity indicated a p-value of less than .01, further supporting the validity of the model (Hair et al., 2014) (see Tables 3 and 4).
In the context of the Structural Equation Model (SEM), this analysis specified the path coefficients (β) for each dimension, as well as the R2 values for the overall model and for each group delineated in the confirmatory factor analysis. The results indicate that two relationships are statistically significant at the 0.0 significance level. Specifically, hypotheses H3 (β=0.255, p=0.001) and H5 (β=0.303, p<0.001) receive empirical support. In contrast, the hypothesis H4 demonstrates statistical significance at a threshold level of 0.10 (β=0.230, p=0.068). The relationships associated with hypotheses H1 and H2 are not statistically significant at the 0.10 level; consequently, these hypotheses are not supported by the data. For hypothesis H4, the empathy exhibited by doctors and nursing staff in addressing patient problems emerges as a critical factor influencing patient satisfaction, with respective factor loadings of 0.964 and 0.963.
Figure 2
Structural Model of the Investigation
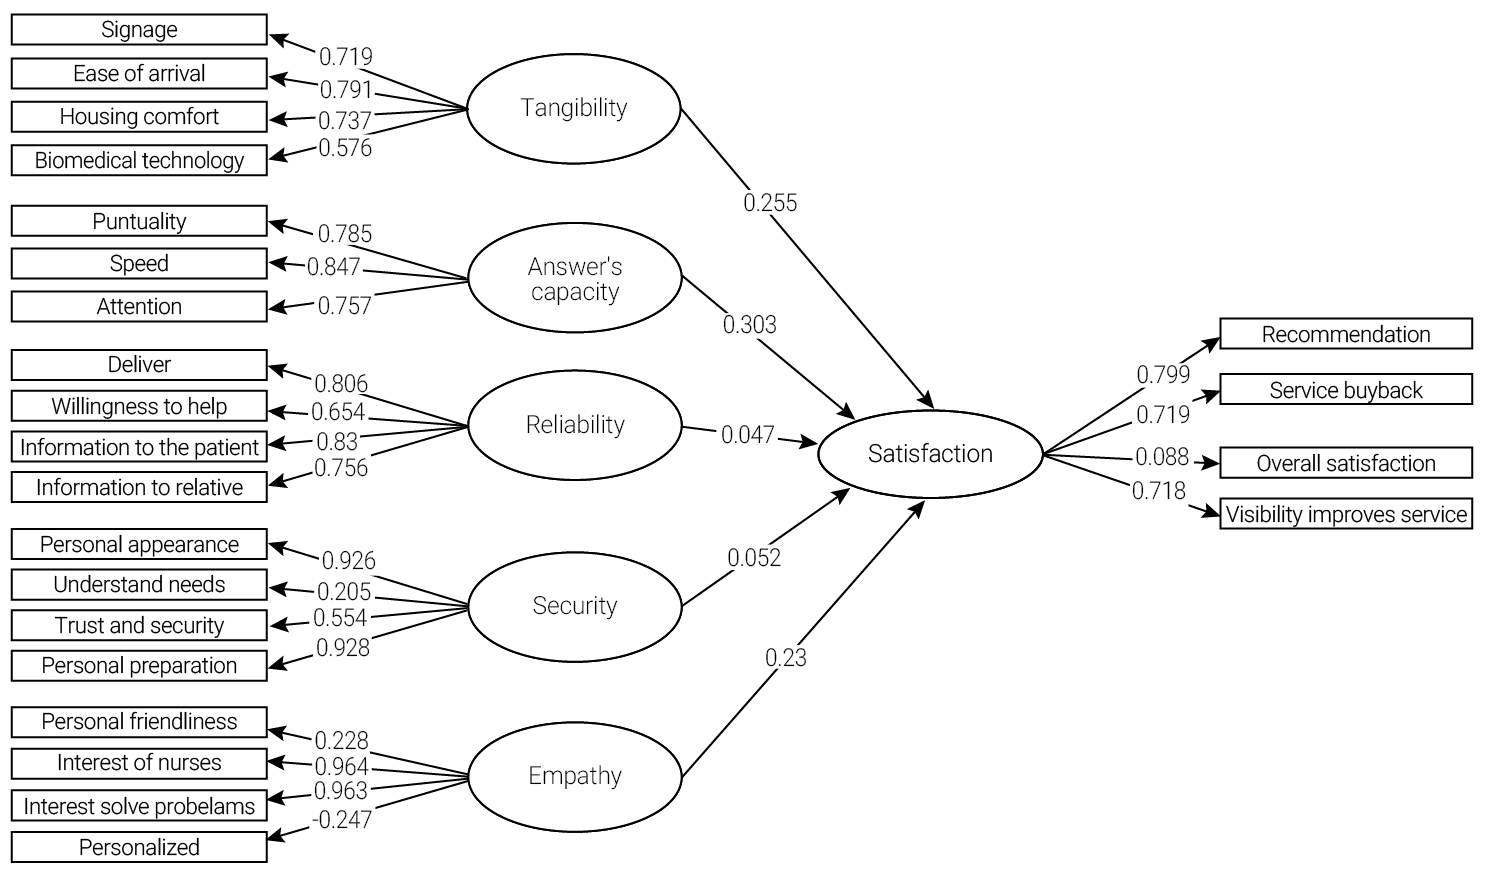
Note. R2: 0.499, Path Coefficients at 0.05 of significance.
In the context of Response Capacity (H5), the speed of medical attention emerges as the most significant factor (cf.=0.847). Among the tangible elements, the ease of accessing the medical center (cf.=.791) and the condition of the medical infrastructure (cf.=.737) are the most prominent elements (Fig. 2).
Table 5
Comparative analysis of hypotheses in the structural model of the study
|
Hypothesis |
General model |
||
|
T-statistic p-value |
T-statistic |
p-value |
|
|
H1 (Reliability to Satisfaction) |
0.047 |
0.732 |
.465 |
|
H2 (Security to Satisfaction) |
0.052 |
0.412 |
.680 |
|
H3 (Tangible elements to Satisfaction) |
0.255 |
3.210 |
.001*** |
|
H4 (Empathy to Satisfaction) |
0.230 |
1.831 |
.068* |
|
H5 (Capacity Response to Satisfaction) |
0.303 |
4.473 |
.000*** |
Note. *** p < 0.01; * p < 0.10.
In the analysis of groups segmented by client type, the Structural Equations Model for the uninsured patients demonstrates a more robust R2 of 0.633 (see Fig. 3) compared to the model for insured patients, which has an R2 of 0.456 (see Fig. 4). Similarly to the general model, the analysis allowed for the examination of the path coefficients associated with various hypotheses for each group, utilizing the p-value to determine significance, as detailed in Table 5.
Table 6
Path coefficients (β) organized by patient type
|
Grupo Hypothesis |
Uninsured |
Insured |
||||
|
Path |
T-statistic |
p-value |
Path |
T-statistic |
p-value |
|
|
H1 (Reliability) |
0.654 |
9.819 |
0.000*** |
0.165 |
1.174 |
0.241 |
|
H2 (Security) |
-0.103 |
1.237 |
.217 |
0.046 |
0.375 |
0.708 |
|
H3 (tangible elements) |
0.227 |
3.014 |
0.003*** |
-0.148 |
0.868 |
0.386 |
|
H4 (Empathy) |
0.190 |
2.463 |
0.014** |
0.423 |
2.871 |
0.004*** |
|
H5 (Response Capacity) |
-0.088 |
1.299 |
.195 |
0.337 |
1.963 |
0.049** |
Note. *** p < 0.01; * p < 0.10.
The results of the uninsured patient model indicated that three relationships are statistically significant at a 0.05 significance level. Specifically, hypotheses H1 (β=0.654, p<0.001), H3 (β=0.227, p=0.003), and H4 (β=0.190, p=0.014) received support from the data. In contrast, hypotheses H2 and H5 were not supported, as they did not reach statistical significance at the 0.05 level (Table 6).
For the group of uninsured patients, those who utilize their own resources for payment, the reliability of the medical center emerged as a significant factor influencing patient satisfaction, as reflected in the information provided to patients (cf.=0.832) and the center’s commitment to fulfilling its promises (cf.=0.826), with a corresponding effect size of(β=0.654). Following reliability, tangible elements represent the second key factor influencing satisfaction (β=0.227); these include clear directional signage for patients (cf.=.786), advanced biomedical technology employed during consultations (cf.=.688) and the condition of the physical infrastructure (cf.=.670). Lastly, another factor impacting the satisfaction of uninsured patients, with a β value of 0.190, is demonstrated through the attentiveness of nurses towards patients (cf.=0.751).
Figure 3
Structural Model for evaluating the uninsured patient group
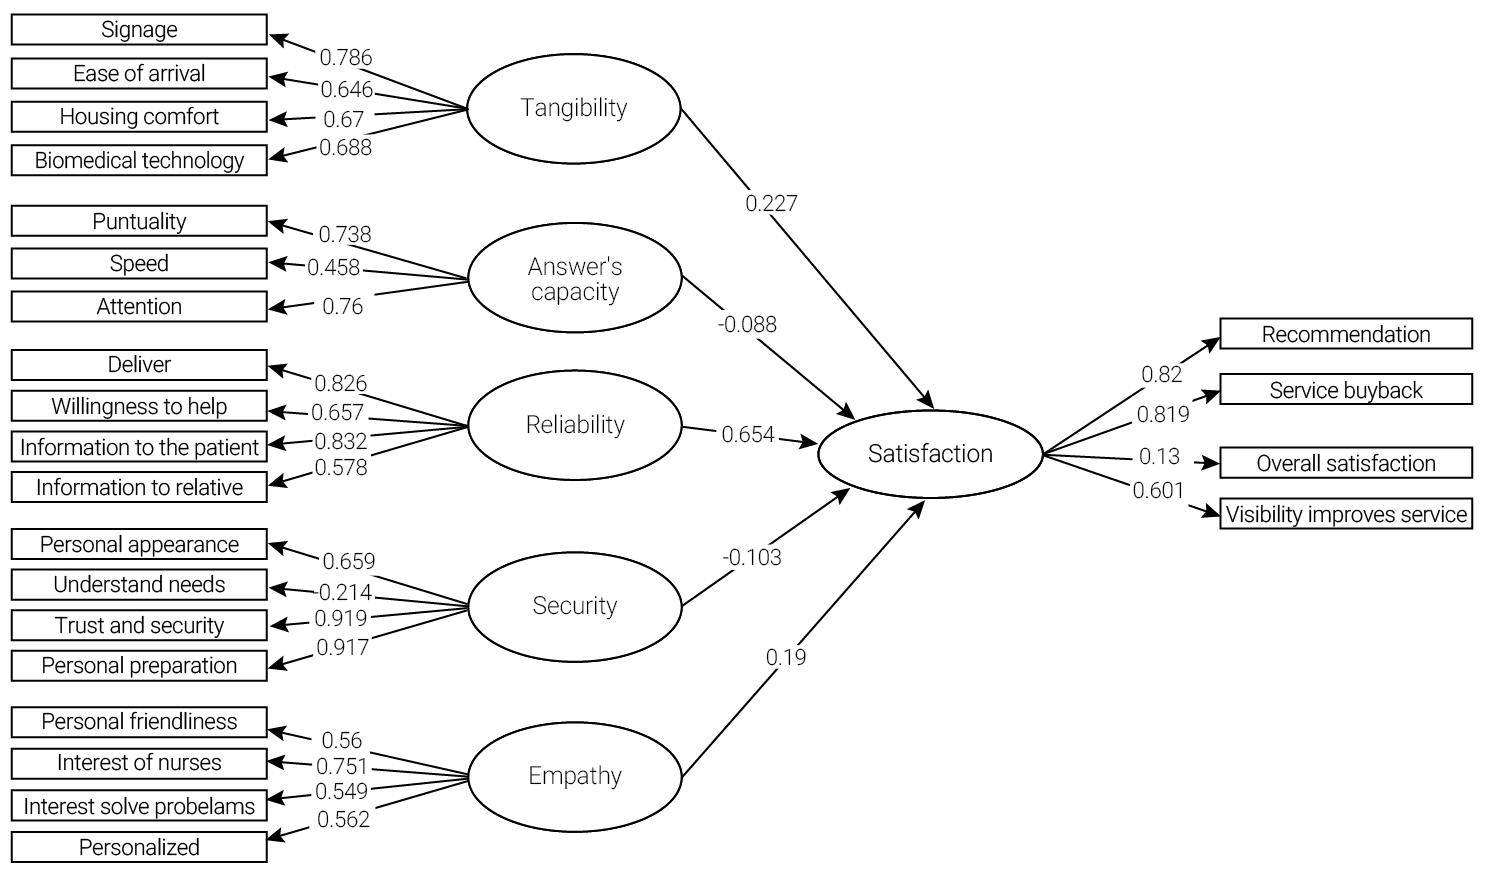
Note. R2: 0.633, Path Coefficients at 0.05 significance.
Conversely, the results derived from the model concerning insured patients indicate that only two relationships achieve statistical significance at the 0.05 level. Specifically, the hypotheses H4 (β=0.423, p<0.004) and H5 (β=0.0 .337, p=0.049) meet this criterion. Consequently, the data do not support hypotheses H1, H2, and H3.
For the population of clients with health insurance, the empathy conveyed through staff friendliness (cf.=0.915) and the attentiveness of the nurses (cf.=0.751) emerge as the most influential factors affecting patient satisfaction (β=0.423). Furthermore, the second critical factor identified is response capacity (β=0.337), with the medical center’s punctuality being noteworthy (cf.=0.738).
Figure 4
Structural model for evaluating the insured patient group
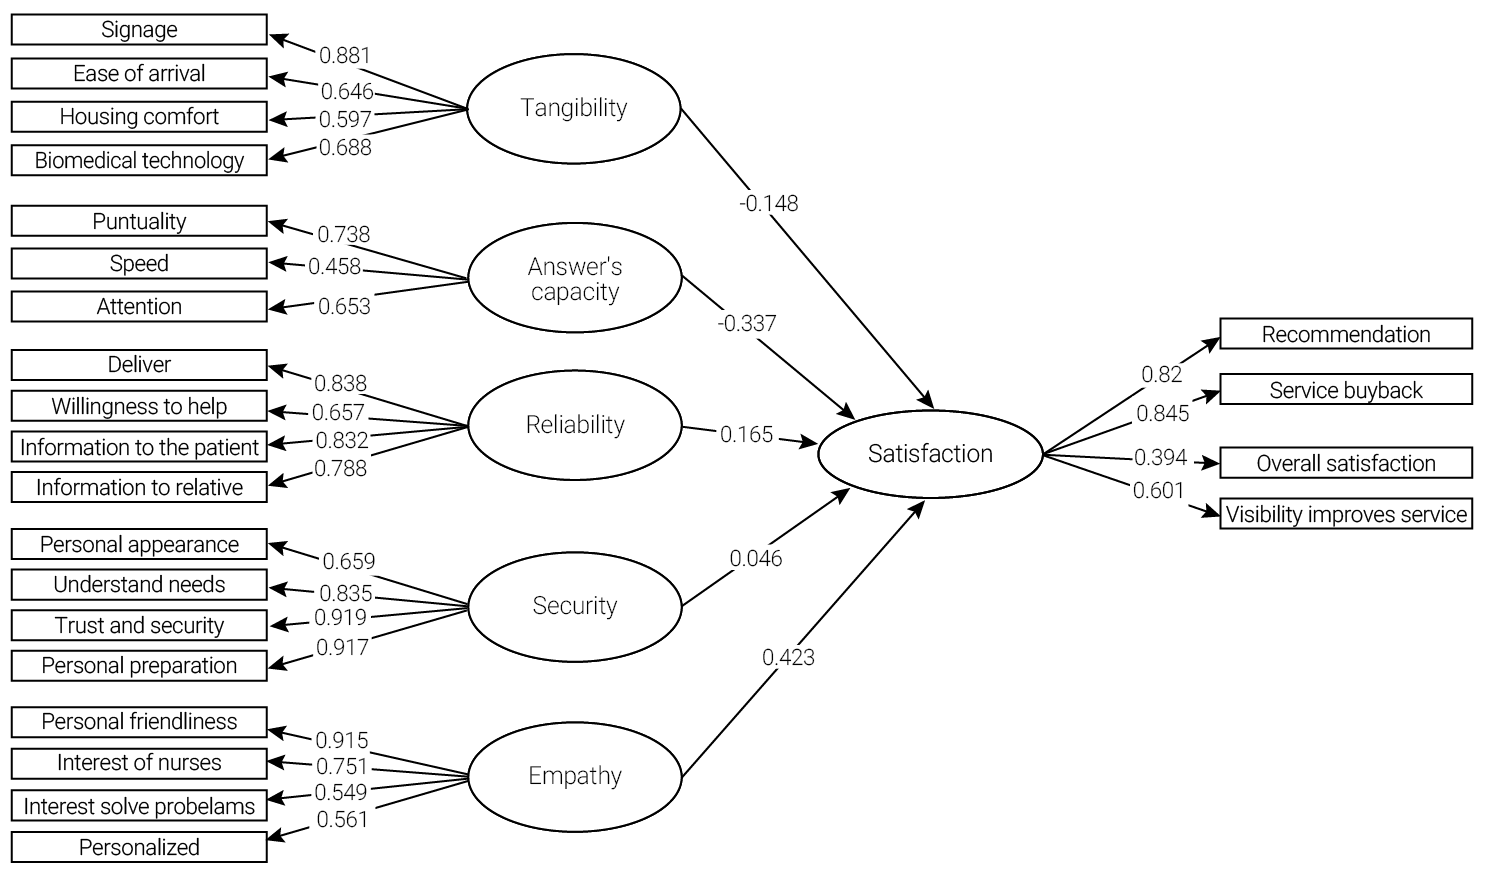
Note. R2: 0.456, Path Coefficients at 0.05 significance.
DISCUSSION AND CONCLUSIONS
The present investigation analyzed the relationship among the five dimensions of the SERVQHOS instrument and client satisfaction at the medical center. To achieve this, a cross-sectional study employing a quantitative approach was carried out with patients at the medical center. The study utilized a Structural Equations Model to evaluate the significant influence of each dimension on satisfaction. The validity of the implemented model was confirmed through a confirmatory factor analysis, indicating that the results are generalizable to larger populations and are representatively significant. Among uninsured patients, the dimensions of Reliability, Tangible Elements, and Empathy exhibited a positive and significant impact on service satisfaction, with Reliability being the most preferred dimension.
In evaluating reliability, the manner and sensitivity with which medical and administrative staff communicate information to patients and their relatives hold significant value for assessing satisfaction. Empathy is also a crucial component; during medical appointments, patients appreciate the devotion shown by medical and nursing personnel when caring for them. Furthermore, with regard to Tangible Elements, effective signage both inside and outside the medical center plays a big role in helping patients navigate the facility, an aspect that users particularly value. Additionally, using updated and technologically advanced medical equipment ranks among the most important factors patients consider regarding the infrastructure of the facility. Therefore, high levels of patient satisfaction are likely to be reflected in their willingness to recommend the medical services to others and in their likelihood of returning to the facility for medical care in the future.
Conversely, among insured patients, the dimensions of Empathy and Response Capacity significantly and positively influence overall service satisfaction. The Empathy dimension highlights that personalized attention enhances the value for the patients seeking care at the medical center. Additionally, the medical personnel’s genuine concern for patients and their commitment to finding workable solutions positively impact patient satisfaction evaluations. There is a strong preference for all the medical center staff to engage in friendly and personalized interactions, reflecting a high degree of empathy and connection with patients. In terms of Response Capacity, shorter waiting times before patients receive care increased their levels of overall satisfaction. Consequently, the satisfaction of these patients who do not directly pay for services will likely affect their likelihood of returning to the medical center, a trend that is expected to be more pronounced among insured patients compared to those who pay out of pocket.
This study makes a significant practical contribution by providing information that enables medical centers to develop differentiated strategies based on the payment methods that patients employ. Given the clear distinction among various payment types, the implementation of operational marketing strategies tailored to each user segment will prove more efficient and cost-effective than traditional mass marketing approaches. Moreover, this information facilitates the establishment of processes and enhancements within the medical center that foster greater patient loyalty.
Research indicates that certain factors hold more significance depending on the patient type. Additionally, the study demonstrates that patient satisfaction within the medical center is strongly correlated with their willingness to recommend the services and to utilize them again.
To enhance the reliability and generalizability of the findings, it is advisable to increase the sample size and conduct the study across other private medical centers in Guayaquil to investigate similarities and differences in patient satisfaction. As private medical centers are theoretically competitors, a broader study would effectively delineate the characteristics influencing patient behavior in Guayaquil.
Declaration on the Use of AI and AI-Assisted Technologies in the Writing Process
This work employs artificial intelligence tools to assist in tasks including layout, design, structural organization, English translation, and proofreading. The authors retain sole intellectual responsibility for all content, analysis, and conclusions presented herein.

REFERENCES
Adner, R. (2006). Match your innovation strategy to your innovation ecosystem. Harvard Business Review, 84(4), 98-107.
Ahen, F. (2022). Community-level health interventions are crucial in the post-COVID-19 era: Lessons from Africa’s proactive public health policy interventions. Humanistic Management Journal, 7(3), 369-390. https://doi.org/10.1007/s41463-022-00127-3
Athey, S., Grabarz, K., Luca, M., & Wernerfelt, N. (2023). Digital public health interventions at scale: The impact of social media advertising on beliefs and outcomes related to COVID vaccines. Proceedings of the National Academy of Sciences, 120(5), e2208110120. https://doi.org/10.1073/pnas.2208110120
Becker, J. M., Ringle, C. M., & Sarstedt, M. (2018). Estimating moderating effects in PLS-SEM and PLSc-SEM: Interaction term generation*data treatment. Journal of Applied Structural Equation Modeling, 2(2), 1-21. https://doi.org/10.47263/jasem.2(2)01
Blanco, A., & Rivero, V. (2009). Calidad de servicio percibida por los clientes residenciales en las oficinas de atención al cliente (OAC) de una empresa telefónica. Ingeniería Industrial: Actualidad y Nuevas Tendencias, 1(3), 31-42. https://www.redalyc.org/articulo.oa?id=215016887004
Chión, S., & Charles, V. (2016). Analítica de datos para la modelación estructural. Pearson.
Coral-Almeida, M., Carrington, S. J., Carrión-Yaguana, V. D., & Mascialino, G. (2022). How not to manage a pandemic, and how to recover from it: Lessons from Ecuador. Facets, 7, 1367-1384. https://doi.org/10.1139/facets-2022-0064
Crosby, P. B. (1992). La calidad no cuesta. El arte de cerciorarse de la calidad. Compañía Editorial Continental.
Czepiel, J. A., & Rosenberg, L. J. (1977). Consumer satisfaction: Concept and measurement. Journal of the Academy of Marketing Science, 5(4), 403-411. https://doi.org/10.1007/BF02722070
Donabedian, A. (1980). Explorations in quality assessment and monitoring: The definition of quality and approaches to its assessment. Health Administration Press.
Federación Ecuatoriana de Seguros. (2022). Datos coyunturales en imágenes. https://www.fedeseg.org/datos
Giese, J. L., & Cote, J. A. (2000). Defining consumer satisfaction. Academy of Marketing Science Review, (1), 1-24. https://www.researchgate.net/publication/235357014
Greenhalgh, T., Humphrey, C., Hughes, J., Macfarlane, F., Butler, C., & Pawson, R. (2009). How do you modernize a health service? A realist evaluation of whole-scale transformation in London. The Milbank Quarterly, 87(2), 391-416. https://doi.org/10.1111/j.1468-0009.2009.00562.x
Guevara-Rosero, G. C. (2023). The effect of the healthcare system’s structure on COVID-19 dynamics in Ecuador. Regional Science Policy and Practice. 15(8), 1795-1820. https://doi.org/10.1111/rsp3.12666
Hair, J. F., Black, W. C., Babin, B. J., & Anderson, R. E. (2014). Multivariate data analysis (7th ed.). Pearson Education Limited.
Instituto Nacional de Estadística y Censos. (2020). Estadísticas vitales: registro estadístico de defunciones generales 2020. https://www.ecuadorencifras.gob.ec/documentos/web-inec/Poblacion_y_Demografia/Defunciones_Generales_2020/2021-06-10_Principales_resultados_EDG_2020_final.pdf
Instituto Nacional de Estadística y Censos. (2022a). Estadísticas vitales: registro estadístico de defunciones generales 2021 (Resultados principales, v2). https://www.ecuadorencifras.gob.ec/documentos/web-inec/Poblacion_y_Demografia/Defunciones_Generales_2021/Principales_resultados_EDG_2021_v2.pdf
Instituto Nacional de Estadística y Censos. (2022b). Registro estadístico de recursos y actividades de salud 2020. https://www.ecuadorencifras.gob.ec/actividades-y-recursos-de-salud/
International Organization for Standardization. (2015). ISO 9000:2015 — Quality management systems: Fundamentals and vocabulary (4th ed.). https://www.iso.org/obp/ui/#iso:std:iso:9000:ed-4:v1
Jabs, J. M., Schwabe, A., Wollkopf, A. D., Gebel, B., Stadelmaier, J., Erdmann, S., Radicke, F., Grundmann, H., Kramer, A., Monsef, I., Rücker, G., Rupp, J., Scheithauer, S., Schmucker, C., Simon, A., & Mutters, N. T. (2022). The role of routine SARS-CoV-2 screening of healthcare-workers in acute care hospitals in 2020: A systematic review and meta-analysis. BMC Infectious Diseases, 22(1), Article 587. https://doi.org/10.1186/s12879-022-07554-5
Jiménez Paneque, R. (2004). Indicadores de calidad y eficiencia de los servicios hospitalarios: Una mirada actual. Revista Cubana de Salud Pública, 30(1), 17-36. https://www.redalyc.org/articulo.oa?id=21430104
Karaca, A., & Durna, Z. (2019). Patient satisfaction with the quality of nursing care. Nursing Open, 6(2), 535-545. https://doi.org/10.1002/nop2.237
Li, X., Krumholz, H. M., Yip, W., Keung Cheng, K., De Maeseneer, J., Meng, Q., Mossialos, E., Li, C., Lu, J., Su, M., Zhang, Q., Roman Xu, D., Li, L., Normand, S.-L. T., Peto, R., Li, J., Wang, Z., Yan, H., Gao, R., … Hu, S. (2020). Quality of primary health care in China: Challenges and recommendations. The Lancet, 395, 1802-1812. https://doi.org/10.1016/S0140-6736(20)30122-7
Malhotra, N. K. (2019). Marketing research: An applied orientation (7th ed.). Pearson.
Masterson, D., Areskoug Josefsson, K., Robert, G., Nylander, E., & Kjellström, S. (2022). Mapping definitions of co-production and co-design in health and social care: A systematic scoping review providing lessons for the future. Health Expectations, 25(3), 902-913. https://doi.org/10.1111/hex.13470
Masuet, A. M. (2010). La calidad de la atención médica ambulatoria en el Hospital Pediátrico del Niño Jesús, de la Ciudad de Córdoba [Tesis de maestría, Universidad Nacional de Córdoba]. Repositorio Digital UNC. https://rdu.unc.edu.ar/handle/11086/254
Ministerio de Salud Pública del Ecuador. (2020). Aumento de capacidad de camas UCI y de hospitalización en Guayas permite atender oportunamente casos COVID-19. https://www.salud.gob.ec/aumento-de-capacidad-de-camas-uci-y-de-hospitalizacion-en-guayas-permite-atender-oportunamente-casos-covid-19/
Mira, J. J., Aranaz, J., Rodríguez-Marín, J., Buil, J. A., Castell, M., & Vitaller, J. (1998). SERVQHOS: Un cuestionario para evaluar la calidad percibida de la atención hospitalaria. Medicina Preventiva, 4, 12-18. http://calite-revista.umh.es/indep/web/art_servqhos.pdf
Mora Contreras, C. E. (2011). La calidad del servicio y la satisfacción del consumidor. Revista Brasileira de Marketing, 10(2), 146-162. https://doi.org/10.5585/remark.v10i2.2212
Mosquera, D. (2017). Encontrar trabajo, un problema para los nuevos médicos en el Ecuador. Edición Médica. https://www.edicionmedica.ec/secciones/profesionales/encontrar-trabajo-un-problema-para-los-nuevos-m-dicos-en-el-ecuador-89684
National Health Service Digital. (2020). NHS outcomes framework indicators — August 2020 release. https://digital.nhs.uk/data-and-information/publications/statistical/nhs-outcomes-framework/august-2020
Olivares, C., Betanzos, N., & Paz, F. (2017). Compromiso organizacional y calidad del servicio en un hospital privado. El Psicólogo Anáhuac, 20, 7-25. https://www.researchgate.net/publication/353196003
Oliver, R. L. (1980). A cognitive model of the antecedents and consequences of satisfaction decisions. Journal of Marketing Research, 17(4), 460-469. https://doi.org/10.1177/002224378001700405
Oliver, R. L. (1997). Satisfaction: A behavioral perspective on the consumer. McGraw-Hill. https://books.google.com.pe/books/about/Satisfaction.html?id=iCeQQgAACAAJ&redir_esc=y
Oliver, R. L., & Swan, J. E. (1989). Consumer perceptions of interpersonal equity and satisfaction in transactions: A field survey approach. Journal of Marketing, 53(2), 21-35. https://doi.org/10.1177/002224298905300202
Ortiz, P. (2016). Nivel de satisfacción del usuario externo sobre la calidad de atención en los servicios de salud según encuesta SERVQUAL, en la micro red Villa-Chorrillos en el año 2014 [Tesis de licenciatura, Universidad Ricardo Palma]. Repositorio URP. https://repositorio.urp.edu.pe/handle/20.500.14138/457
Ortiz-Culcay, O., Fernández-García, C., & Pérez-Rico, C. (2022). Analysis of prepaid medicine coverage in Pichincha. Revista Ciencia UNEMI, 15(38), 1-13. https://doi.org/10.29076/issn.2528-7737vol15iss38.22pp1-13p
Parasuraman, A., Zeithaml, V. A., & Berry, L. L. (1988). SERVQUAL: A multiple-item scale for measuring consumer perceptions of service quality. Journal of Retailing, 64(1), 12-40. https://psycnet.apa.org/record/1989-10632-001
Quintuña Velecela, M. A. (2021). Factores asociados a la calidad de atención al paciente durante la pandemia por SARS-CoV-2/COVID-19. RECIMUNDO, 5(esp. 1), 118-125. https://doi.org/10.26820/recimundo/5.(esp.1).nov.2021.118-125
Shewhart, W. A. (1997). Control económico de la calidad de productos manufacturados. Ediciones Díaz de Santos. https://www.editdiazdesantos.com/libros/shewhart-wa-control-economico-de-la-calidad-de-productos-manufacturados-L03003040101.html
Tan, C. N. L., Ojo, A. O., Cheah, J. H., & Ramayah, T. (2019). Measuring the influence of service quality on patient satisfaction in Malaysia. Quality Management Journal, 26(3), 129-143. https://doi.org/10.1080/10686967.2019.1615852
Thompson, A. G. H., & Suñol, R. (1995). Expectations as determinants of patient satisfaction: Concepts, theory and evidence. International Journal for Quality in Health Care, 7(2), 127-141. https://doi.org/10.1093/intqhc/7.2.127
Torres, M., & Vásquez, C. L. (2015). Modelos de evaluación de la calidad del servicio: Caracterización y análisis. Compendium, 18(35), 57-76. https://www.redalyc.org/articulo.oa?id=88043199005
Van Barneveld, K., Quinlan, M., Kriesler, P., Junor, A., Baum, F., Chowdhury, A., Junankar, P. N., Clibborn, S., Flanagan, F., Wright, C. F., Friel, S., Halevi, J., & Rainnie, A. (2020). The COVID-19 pandemic: Lessons on building more equal and sustainable societies. Economic and Labour Relations Review, 31(2), 133-157. https://doi.org/10.1177/1035304620927107
Westbrook, R. A., & Reilly, M. D. (1983). Value-percept disparity: An alternative to the disconfirmation of expectations theory of consumer satisfaction. Advances in Consumer Research, 10, 256-261. https://www.acrwebsite.org/volumes/6120/volumes/v10/NA-10
Wu, T. C., & Ho, C. T. B. (2023). A scoping review of metaverse in emergency medicine. Australasian Emergency Care, 26(1), 75-83. https://doi.org/10.1016/j.auec.2022.08.002