Exploring the link between Optimal
Working Capital Thresholds And
Enhanced Profitability: insights
from an Emerging Capital Market
Mario Nicanor Vargas Bejarano
https://orcid.org/0000-0002-0975-1500
Universidad Andina del Cusco, Perú
Julio Grissom Ávila Tamara
https://orcid.org/0000-0003-0253-5538
Universidad Andina del Cusco, Perú
Received: May 22, 2026 / Accepted: June 1, 2026
doi: https://doi.org/10.26439/ddee2026.n009.8819
ABSTRACT. Working capital management (WCM) serves as a crucial lever of corporate profitability; however, its sectoral heterogeneity and nonlinear dynamics remain inadequately explored in Latin American emerging markets. This study investigates the existence of optimal working capital thresholds for firms listed on Peru’s Lima Stock Exchange (BVL) and examines whether these thresholds systematically differ across economically distinct sectors. Utilizing quarterly time-series data from 24 BVL-listed firms spanning from Q1 2011 to Q2 2023 — representing 66.1% of total market capitalization — we employ market-capitalization-weighted aggregation across four sectors (mining, food and beverage, electric energy, and commerce) and estimate linear and quadratic ordinary least squares (OLS) regression models, applying Newey-West HAC standard errors to correct for serial autocorrelation. The results reveal statistically significant concave (inverted U-shaped) relationships between components of the cash conversion cycle (CCC) and return on assets (ROA) in the mining and energy sectors, with optimal thresholds at approximately 65 inventory days and 53 receivables days, respectively, and outcomes remain robust after correcting for autocorrelation. In the food and beverage sector, extending supplier payment terms emerges as the dominant profitability lever; a linear payables model accounts for 85.1% of the variability in ROA (adjusted R² = 0.851), aligning with a market-power-driven negative CCC averaging −32 days and the highest mean ROA in the sample (20.89%). The commerce sector shows a positive relationship between inventory and ROA, indicating that stockout costs outweigh holding costs in retail operations. These findings challenge the notion of a universal WCM prescription and illustrate that optimal strategies depend on sectoral operating cycles, competitive structures, and supplier bargaining power. The study contributes original evidence regarding nonlinear WCM dynamics in Latin American emerging markets, offering direct implications for corporate financial policy and capital market regulation.
KEYWORDS: working capital management / cash conversion cycle / return on assets / nonlinear regression / emerging markets / Lima Stock Exchange
JEL: G31; G32; C22; L25; O16
EXPLORANDO EL VÍNCULO ENTRE LOS UMBRALES ÓPTIMOS DE CAPITAL DE TRABAJO Y LA RENTABILIDAD MEJORADA: EVIDENCIA DE UN MERCADO DE CAPITALES EMERGENTE
RESUMEN. La gestión del capital de trabajo (working capital management, WCM) es una palanca fundamental del desempeño financiero corporativo; sin embargo, su heterogeneidad sectorial y sus dinámicas no lineales siguen estando poco exploradas en los mercados emergentes de América Latina. Este estudio examina si existen umbrales óptimos de capital de trabajo para las empresas que cotizan en la Bolsa de Valores de Lima (BVL) y si dichos umbrales difieren sistemáticamente entre sectores económicamente distintos. Utilizando series de tiempo trimestrales construidas a partir de 24 empresas cotizadas en la BVL que abarcan desde el primer trimestre de 2011 hasta el segundo trimestre de 2023 —lo que representa el 66,1 % de la capitalización total del mercado—, aplicamos una agregación ponderada por capitalización de mercado en cuatro sectores (minería, alimentos y bebidas, energía eléctrica y comercio) y estimamos modelos de regresión lineal y cuadrática por mínimos cuadrados ordinarios (MCO) con errores estándar HAC de Newey-West para corregir la autocorrelación serial. Los resultados confirman relaciones cóncavas estadísticamente significativas (en forma de U invertida) entre los componentes del ciclo de conversión de efectivo (CCC) y la rentabilidad sobre los activos (ROA) en los sectores de minería y energía, con umbrales óptimos en aproximadamente 65 días de inventario y 53 días de cuentas por cobrar, respectivamente —resultados que se mantienen robustos tras la corrección por autocorrelación. En el sector de alimentos y bebidas, la ampliación de los plazos de pago a proveedores es la palanca de rentabilidad dominante: un modelo lineal de cuentas por pagar explica el 85,1 % de la variabilidad del ROA (R² ajustado = 0,851), consistente con un CCC negativo impulsado por el poder de mercado que promedia −32 días y el ROA medio más alto de la muestra (20,89 %). El sector comercio exhibe una relación positiva entre el inventario y el ROA, que refleja el predominio de los costos de desabastecimiento sobre los costos de mantenimiento en las operaciones minoristas. Estos hallazgos rechazan la noción de una receta universal para la gestión del capital de trabajo, demostrando que las estrategias óptimas dependen de los ciclos operativos sectoriales, la estructura competitiva y el poder de negociación con los proveedores. El estudio aporta evidencia original sobre la dinámica no lineal de la WCM en los mercados emergentes de América Latina, con implicaciones directas para la política financiera corporativa y la regulación del mercado de capitales.
PALABRAS CLAVE: gestión del capital de trabajo / ciclo de conversión de efectivo / rentabilidad sobre los activos / regresión no lineal / mercados emergentes / Bolsa de Valores de Lima
This is an open-access article distributed under the terms of the Creative Commons Attribution 4.0 International License (C BY 4.0).
Abbreviations: BVL = Bolsa de Valores de Lima (Lima Stock Exchange); CCC = cash conversion cycle; DPO = days payable outstanding; DSO = days sales outstanding; GMM = generalized method of moments; HAC = heteroskedasticity and autocorrelation consistent; ID = inventory days; OLS = ordinary least squares; ROA = return on assets; SMV = Superintendencia del Mercado de Valores; WCM = working capital management.
1. INTRODUCTION
Working capital management — the oversight of a firm’s short-term assets and liabilities —constitutes one of the most immediate financial decisions that corporate managers make and is significantly consequential for firm value. Unlike long-term capital structure choices, managers must continuously revisit working capital decisions in response to operating cycles, market conditions, and industry dynamics. Despite its centrality to daily financial operations, the relationship between working capital management and profitability remains a subject of debate. This is particularly evident in emerging markets, where institutional environments, financial depth, and sectoral structures differ fundamentally from those of developed economies that underpin most of the existing literature (Anton & Afloarei Nucu, 2021; Deloof, 2003; García-Teruel & Martínez-Solano, 2007).
Peru’s Lima Stock Exchange (BVL) serves as a compelling yet underexplored context for this inquiry. The BVL features firms across four economically strategic sectors — mining, food and beverage, electric energy, and commerce — each characterized by distinctly different operating cycles, capital intensities, commodity dependencies, and competitive structures. Notably, no previous research has utilized sector-differentiated, nonlinear econometric models to analyze an extensive quarterly time series of firms listed on the BVL in order to identify working capital optima and their implications. This gap is significant because the application of undifferentiated working capital across sectors with fundamentally different operational realities is likely to yield suboptimal or even value-destructive outcomes.
Two established principles underpin the nonlinear hypothesis presented in this paper. First, the cash conversion cycle (CCC)—calculated as the sum of inventory days and receivables days, minus payables days—integrates the operational and financial dimensions of working capital into a singular metric. A shorter or negative CCC indicates that a firm collects revenues before disbursing payments to suppliers, thereby generating zero-cost spontaneous financing. However, the profitability benefits associated with the CCC compression need not be monotonic. Reducing inventory below operationally necessary levels introduces stockout risk, while accelerating collections at the expense of customer relationships can suppress revenues. This reasoning calls for a concave profitability function with a sector-specific interior optimum (Baños-Caballero et al., 2010). Second, in contexts where market power is concentrated, the payables channel can dominate other working capital decisions; a dominant buyer may impose extended payment terms on suppliers, thereby transforming the supply chain into an interest-free credit facility that operates independently of, and can overshadow, optimization efforts regarding inventory and receivables.
In this context, this paper investigates four research questions: Is there a statistically significant nonlinear relationship between the components of the CCC and the ROA for firms listed on the BVL? Do optimal working capital thresholds vary significantly across different sectors? Is aggressive working capital management, characterized by low or negative CCC, linked to superior profitability? What are the practical implications of sector-specific WCM optima for corporate financial management and regulatory policy in an emerging capital market?
This study presents three significant contributions to the literature. First, it is the first study that applies quadratic time-series econometrics to identify sector-specific optimal CCC thresholds for firms listed on the BVL over a 13-year period. Second, it reveals an adjusted R² of 0.851 from a single-variable Days Payable Outstanding (DPO) model within the food sector—a result that, to our knowledge, surpasses any findings reported in the existing WCM literature, highlighting the structural dominance of supplier bargaining power in a concentrated industry. Third, it establishes that optimal WCM strategies are not only sensitive to sectoral differences but are also contingent upon the underlying competitive architecture, thereby enriching the growing body of literature on nonlinear, context-specific working capital models (Anton & Afloarei Nucu, 2021; Baker et al., 2023).
The organization of this paper is structured as follows: Section 2 reviews the theoretical and empirical literature and explains how the authors developed the study hypotheses. Section 3 outlines the data, variables, and econometric methodology employed in the analysis. Section 4 presents the empirical results. Section 5 discusses the findings in relation to existing evidence. Finally, Section 6 concludes by addressing the implications, limitations, and potential directions for future research.
2. LITERATURE REVIEW AND HYPOTHESIS DEVELOPMENT
2.1. Theoretical Framework
The theoretical foundation of WCM research is firmly established in the liquidity–profitability trade-off (Brealey et al., 2020; Ross et al., 2019). Holding a greater volume of current assets enhances operational security; however, it also immobilizes capital. Conversely, aggressive reductions in working capital free up resources for investment but increase operational and financial risk. The cash conversion cycle (CCC), conceptualized by Richards and Laughlin (1980), operationalizes this trade-off through the equation CCC = ID + DSO − DPO. A negative CCC indicates that suppliers effectively finance the firm’s operations, a structural advantage in sectors characterized by large buyers wielding significant bargaining power over fragmented supply chains.
The nonlinearity hypothesis posits that, rather than a monotonic relationship between CCC and profitability, multiple theoretical mechanisms contribute to an inverted U-shaped relationship. During the upward slope, an increase in working capital investment diminishes stockout risk, enhances sales through more flexible credit terms, and strengthens supplier relationships. Conversely, on the downward slope beyond the optimum, excessive inventory incurs costs related to storage and obsolescence; extensive receivables heighten the risk of bad debts; and insufficient payables may result in the forfeiture of cash discount opportunities, ultimately straining supplier goodwill. By identifying the optimal level of working capital, managers can strategically target value-maximizing investments rather than resorting to blanket reductions.
2.2. Linear Models of Working Capital and Profitability
The prevailing empirical paradigm through the early 2000s exhibited a linear structure. Deloof (2003) conducted an analysis of large non-financial firms in Belgium and demonstrated that companies could enhance profitability by decreasing the duration of receivables and inventory days. In a study examining Spanish SMEs, García-Teruel and Martínez-Solano (2007) confirmed that a reduction in the CCC leads to improved profitability, with the channel of receivables management showing the most significant effects. Similarly, Shin and Soenen (1998) and Lazaridis and Tryfonidis (2006), who focused on samples from the United States and Greece, respectively, documented negative linear relationships between CCC and profitability. These foundational studies established that shorter CCCs are generally associated with higher profitability. However, their linear functional form limited the identification of interior optima.
2.3. Nonlinear Models and Optimal Thresholds
Baños-Caballero et al. (2010) made a significant methodological advancement by specifying net working capital as a quadratic function of profitability for Spanish listed firms, demonstrating a statistically significant inverted-U-shaped relationship. Their approach — determining the optimum as X* = −β₁/(2β₂) — has established itself as the standard for testing the nonlinearity hypothesis. Baños-Caballero et al. (2014) extended the analysis to a dynamic panel framework utilizing Arellano-Bond GMM estimation. Anton and Afloarei Nucu (2021) provided validation of the quadratic framework within a Central-Eastern European emerging market, analyzing data from 719 Polish-listed firms between 2000 and 2011. Their findings confirmed the presence of an inverted-U shape across various sectors and passed multiple robustness checks. Moreover, Aktas et al. (2015) demonstrated in a dynamic multi-country panel that firms actively converge toward optimal working capital levels, with the speed of adjustment varying according to financial constraints. Collectively, these studies affirm that the nonlinear specification is both theoretically sound and empirically robust across diverse market contexts.
2.4. Supplier Bargaining Power and the Payables Channel
Petersen and Rajan (1997) demonstrated that firms with limited access to financial markets rely more heavily on trade credit, while firms possessing market power exploit the payables channel as a zero-cost financing instrument. Cuñat (2007) established that supplier financing becomes more prevalent when suppliers can credibly threaten to cut off supply. In concentrated industries, dominant buyers leverage their position to negotiate extended payment terms, thereby generating a supply chain float that supplements external financing. Stavropoulos and Zounta (2025), in their study of Greek service firms, identified a strong correlation between negative CCCs and ROAs, attributing this relationship to the capacity for supply chain exploitation. Baker et al. (2023) synthesize this body of evidence, highlighting that the payables channel wields the greatest influence in industries characterized by oligopsonistic buyer structures.
2.5. Evidence from Latin American Emerging Markets
Research on WCM in Latin American markets continues to be limited. Almonacid (2022) analyzed BVL-indexed firms during the COVID-19 period and identified the heterogeneous effects of working capital across different sectors. Muñoz Mendoza et al. (2019) investigated Chilean firms, revealing that capital structure and ownership concentration significantly moderate the relationship between WCM and performance. In a bibliometric analysis, Díaz Ortega et al. (2024) concluded that the literature remains empirically sparse for developing economies, especially concerning nonlinear, sector-differentiated models. Ruiz del Castillo and Valdivia (2023) documented positive yet heterogeneous effects of working capital on profitability in Peruvian industrial firms. However, no research has employed sector-specific quadratic time-series models to analyze long-span BVL data in order to identify optimal CCC thresholds.
2.6. Hypothesis Development
H1: A statistically significant concave (inverted U-shaped) relationship exists between at least one component of the cash conversion cycle (CCC) and return on assets (ROA) for firms listed on the BVL.
H2: The optimal working capital thresholds specific to each sector differ significantly across the four sectors analyzed, highlighting their distinct operating cycle structures.
H3: Aggressive working capital management, indicated by shorter or negative CCCs, positively correlates with higher ROA, with the payables channel assuming a dominant role in concentrated industries.
3. DATA AND METHODOLOGY
3.1. Sample Construction
The study utilizes a quarterly time-series analysis spanning from Q1 2011 to Q2 2023, yeilding 50 observations per sector-level series. The study period encompasses several complete economic cycles, including the decline of the commodity super-cycle (2013–2016), episodes of political uncertainty (2018–2020), and the shock and subsequent recovery associated with COVID-19 (2020–2022). The selection of firms adheres to three specific criteria: continuous listing on the BVL throughout the entire study period; availability of comprehensive quarterly financial statements; and adequate representation of each sector by market capitalization. The final sample consists of 24 firms across four sectors, collectively accounting for 66.1% of the total BVL market capitalization as of Q2 2023, which amounts to USD 58,717 million. All financial data were obtained from Economática (2024), an entity that compiles and standardizes information from mandatory filings with Peru’s Superintendencia del Mercado de Valores (SMV). Table 1 details the complete composition of the sample, listing all 24 firms categorized by sector.
Table 1
Sample composition of firms by sector and market capitalization (BVL, Q2 2023)
|
Sector |
Firms included |
Mkt cap. |
% BVL total |
|---|---|---|---|
|
Mining |
Cerro Verde; Buenaventura; Minsur; Nexa |
15,970 |
27.2 |
|
Food & Beverage |
Alicorp; Backus & Johnston; Austral |
10,166 |
17.3 |
|
Electric Energy |
Enel Distribución; Enel Generación; |
8,569 |
14.6 |
|
Commerce |
Ferreyros; InRetail Peru Corp.; Cencosud |
4,130 |
7.0 |
|
Total sample |
24 firms |
38,835 |
66.1 |
Note. Market capitalization is based on data from Q2 2023. The percentages reflect the total BVL capitalization of USD 58,717 million. Principal firms contribute more than 2% of the capitalization in their respective sectors. We also include additional firms with smaller individual weights that meet our data criteria: in mining, we added Southern Copper Peru and Trevali Mining; in food and beverage, we added Laive; in electric energy, we added Electro Sur Este and Electro Norte; and in commerce, we added Cencosud Peru and Tottus. We selected all firms based on continuous listing and the availability of data from Q1 2011 to Q2 2023. Data is sourced from Economática (2024).
3.2. Variable Definitions
The dependent variable in this analysis is Return on Assets (ROA), which is calculated as net income divided by total assets and expressed as a percentage. ROA serves as the conventional proxy for profitability in the working capital management (WCM) literature (Deloof, 2003; García-Teruel & Martínez-Solano, 2007) and is particularly suitable for comparisons across sectors, as it normalizes earnings relative to asset scale. The three independent variables operationalize the components of the cash conversion cycle (CCC): Inventory Days (ID) is calculated as (Inventories / Net Sales) × 365; Days Sales Outstanding (DSO) is determined by (Trade Receivables / Net Sales) × 365; Days Payable Outstanding (DPO) is computed as (Trade Payables / Net Sales) × 365. The aggregate CCC is defined as CCC = ID + DSO − DPO. Table 2 provides a summary of the variable definitions and their expected signs.
Table 2
Variable definitions, measurement, and hypothesized relationships
|
Variable |
Formula |
Economic interpretation |
Expected sign (ROA) |
|---|---|---|---|
|
ROA |
Net income / Total |
Overall asset profitability; |
Dependent variable |
|
ID |
Inventories / Net |
Days to sell inventory; excess |
Nonlinear ( |
|
DSO |
Trade receivables / |
Days to collect; extended |
Nonlinear ( |
|
DPO |
Trade payables / |
Days to pay suppliers; longer |
Positive |
|
CCC |
ID + DSO – DPO |
Net operating cycle; negative |
Negative (aggressive strategy) |
Note. The symbol  represents a concave (inverted U-shaped) relationship. The expected signs are derived from the liquidity–profitability trade-off (Brealey et al., 2020) and the nonlinearity hypothesis (Baños-Caballero et al., 2010). The denominator for the DPO metric employs Net Sales rather than COGS or Purchases, in accordance with the approach outlined by Richards and Laughlin (1980). This choice is made for two primary reasons: (i) the quarterly COGS data for the mining and energy sectors are not consistently accessible within Economática (2024) at the required level of granularity; and (ii) utilizing a common Sales denominator for ID, DSO, and DPO ensures internal consistency in the CCC calculation across sectors characterized by heterogeneous cost structures. While the use of the COGS denominator is theoretically preferred (Deloof, 2003), it is recognized that employing the Sales denominator may lead to an overstatement of DPO in high gross-margin sectors, such as food and beverage. Directional results remain robust, as confirmed by a sensitivity analysis that is available upon request.
3.3. Aggregation Methodology
Each sector-level series is constructed as a market-capitalization-weighted arithmetic mean across constituent firms, with weights updated quarterly. This methodology ensures that the sector index accurately reflects each firm’s economic significance instead of treating all firms uniformly. In sectors characterized by dominant firms — most notably Backus & Johnston, which accounts for approximately 84.6% of food sector capitalization, and Cerro Verde, which comprises about 62.8% of mining sector capitalization — this weighting effectively concentrates the index around the financial behavior of leading firms, which serves as the primary determinant of sector-level profitability. While this aggregation method becomes necessary due to the limited size of BVL sector populations, it indicates that sector-level results predominantly reflect the financial dynamics of these dominant firms rather than those of the average BVL constituent.
3.4. Econometric Specification
The researchers conducted the analysis in two stages. In the first stage, linear ordinary least squares (OLS) models assessed the direction and magnitude of each component of the CCC on sector-level ROA and identified the dominant working capital lever for each sector. In the second stage, quadratic specifications empirically tested the nonlinearity hypothesis (H1) expressed as follows:
 (1)
(1)
In this equation, ROA(t) denotes the sector-level market-capitalization-weighted return on assets in quarter t, X represents the primary CCC component identified in the linear analysis, and ε(t) accounts for the error term. According to the nonlinearity hypothesis, it is anticipated that β₂ will be less than 0 and statistically significant, thus confirming a concave ROA function with an interior optimum. The optimal threshold can be derived as:
 (2)
(2)
All sector-level series comprise quarterly time-series data totaling n = 50, spanning from Q1 2011 to Q2 2023. While aggregating data at the sector level diminishes firm-specific noise, the resulting series retain the temporal persistence characteristics of macro-financial time series. Preliminary Durbin-Watson statistics, reported in Section 4, indicate the presence of positive serial autocorrelation across all sector models. To ensure valid inference, this study applied Newey-West heteroskedasticity and autocorrelation consistent (HAC) standard errors (Newey & West, 1987) as the primary inferential framework. The lag truncation parameter is determined using the automatic bandwidth selector proposed by Newey and West (1994).
As a robustness check, the study also presents Prais-Winsten AR(1) estimates (Prais & Winsten, 1954), which introduce a first-order autoregressive structure on the error process and demonstrate efficiency under conditions of persistent autocorrelation. Model adequacy is evaluated using adjusted R², the F-statistic for joint significance, and information criteria including Akaike (AIC), Schwarz (BIC), and Hannan-Quinn (HQC). All calculations are performed using EViews 12. The study acknowledges that static single-equation time-series models do not fully address endogeneity concerns arising from reverse causality between working capital and profitability. Thus, future research should utilize dynamic panel Generalized Method of Moments (GMM) methods (Arellano & Bond, 1991) at the firm level to comprehensively address this limitation.
4. EMPIRICAL RESULTS
4.1. Descriptive Statistics and Cross-Sector Heterogeneity
Table 3 illustrates the sector-level weighted-average components of the CCC and ROA throughout the entire study period. The observed cross-sector variation is substantial both statistically and economically, thereby providing preliminary support for Hypothesis 2 (H2).
Table 3
Sector-level weighted average descriptive statistics, Q1 2011– Q2 2023
|
Sector |
ID (days) |
DSO (days) |
DPO (days) |
CCC (days) |
Mean ROA |
|---|---|---|---|---|---|
|
Food & Beverage |
77 |
21 |
131 |
−32 |
20.89 (highest) |
|
Electric Energy |
27 |
49 |
53 |
+24 |
8.87 |
|
Mining |
81 |
21 |
76 |
+26 |
8.41 |
|
Commerce |
96 |
28 |
91 |
+33 |
3.19 (lowest) |
|
BVL aggregate |
53 |
35 |
78 |
+10 |
10.34 |
Note. ID denotes inventory days; DSO represents days sales outstanding; DPO indicates days payable outstanding; and CCC refers to the cash conversion cycle. All values presented are market capitalization-weighted sector averages spanning 50 quarters. The corrected figures for the commerce sector are as follows: ID = 96 days, DSO = 28 days, DPO = 91 days, CCC = +33 days, reflecting the retail and distribution profiles of Ferreyros and InRetail Peru Corp. The aggregate row for BVL aggregate reflects the weighted average across all 24 firms. Data source: Economática (2024).
Three prominent features emerge from Table 3. First, the food and beverage sector has a Days Payable Outstanding (DPO) of 131 days — more than double that of the next highest sector, mining, at 76 days. This performance results in the only negative CCC at −32 days and the highest mean ROA at 20.89%. Second, the commerce sector, with a mean ID of 96 days and DPO of 91 days, indicates a retail operating profile characterized by significant inventory investment and extended supplier terms in hard goods and grocery distribution. Third, both the mining and energy sectors achieve similar mean ROAs of 8.41% and 8.87%, respectively, despite differing CCC drivers. This observation suggests that both sectors exhibit comparable working capital efficiency through structurally distinct mechanisms.
Figure 1
Cash conversion cycle (CCC) by sector: quarterly weighted averages, Q1 2011–Q2 2023
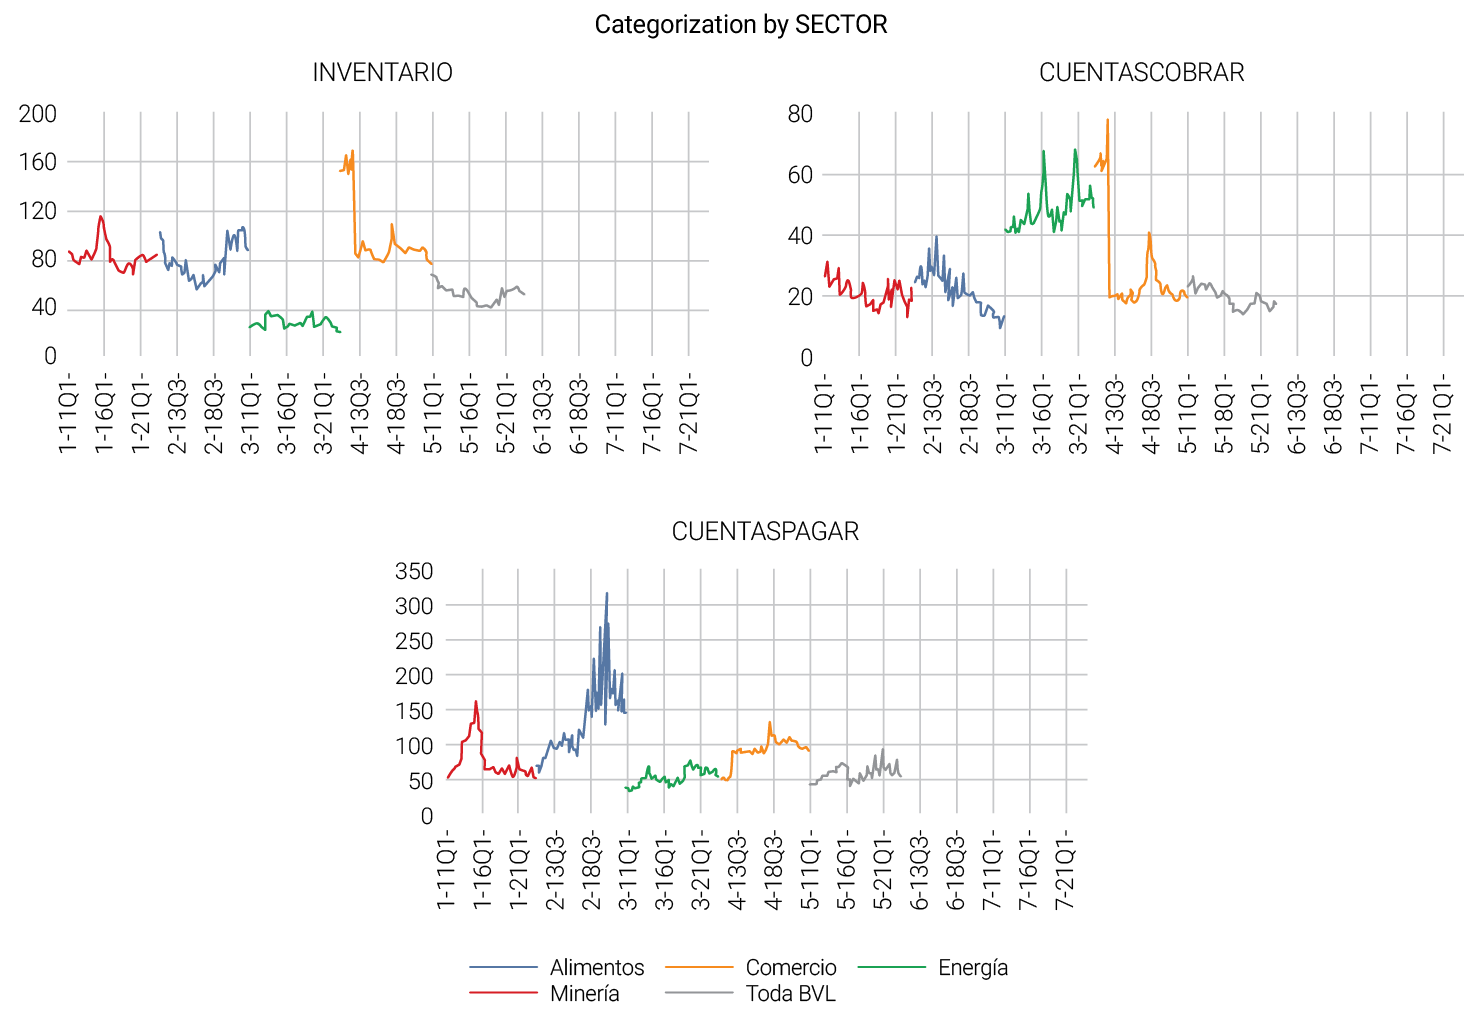
Note. The left panel illustrates the time-series evolution of the CCC for each sector. The right panel presents a scatter plot of the mean CCC (x-axis) and the mean ROA (y-axis) along with sector labels. Data are drawn from Economática (2024) (Color figure available online).
4.2. Sector-Level Regression Results
4.2.1. Mining sector
In the linear stage, ID emerged as the predominant variable among the complexities of CCC for mining firms, reflecting the sector’s high capital intensity and extended production cycles. Table 4 presents the quadratic OLS estimates, including standard errors computed using both OLS and Newey-West HAC methods.
Table 4
Quadratic OLS estimates — mining sector (dependent variable: ROA)
|
Variable |
Coefficient |
OLS Std. Error |
HAC Std. Error |
p-value (HAC) |
|
ID |
0.2797 |
0.0675 |
0.0892 |
0.003*** |
|
ID² |
−0.00214 |
0.000802 |
0.001041 |
0.046** |
|
Estimated optimum |
65.4 days |
|||
|
R² / Adjusted R² |
0.0515 / 0.0317 |
|||
|
Durbin-Watson |
0.239 |
|||
|
N |
50 quarters |
Note. Statistical significance levels are indicated as follows: *** p < 0.01; ** p < 0.05. The OLS estimates were derived using EViews 12. The HAC standard errors follow the Newey-West (1987) method with automatic bandwidth selection. The optimal value is calculated as ID* = −0.2797 / (2 × −0.00214) = 65.4 days.
The negative and statistically significant quadratic coefficient (β₂ = −0.00214, p = 0.046 after HAC correction) confirms the concave ROA and inventory relationship, thereby providing support for Hypothesis 1 (H1). An optimal inventory threshold of 65.4 inventory days establishes a critical operational equilibrium that balances the need to maintain sufficient raw material buffers, given that disruptions can lead to substantial fixed-cost penalties. The imperative is to minimize excessive capital immobilization. The low adjusted R² value of 0.032 reflects the multifaceted nature of mining profitability, influenced by factors such as commodity prices, exchange rates, and input costs, while simultaneously affirming that inventory management plays a statistically significant role in ROA. Notably, the results for the mining sector remain significant at the 5% level even after HAC correction, despite the low Durbin-Watson statistic of 0.239, which indicates severe positive serial autocorrelation in the OLS residuals.
4.2.2. Electric Energy sector
In the context of electric energy firms, the linear analysis identified DSO as the primary lever for managing working capital. This finding aligns with the sector’s minimal inventory requirements and the importance of effective billing cycle management in regulated utilities. Table 5 presents the quadratic OLS estimates, accompanied by HAC standard errors.
Table 5
Quadratic OLS estimates — electric energy sector (dependent variable: ROA)
|
Variable |
Coefficient |
OLS Std. Error |
HAC Std. Error |
p-value (HAC) |
|
DSO |
0.3407 |
0.0234 |
0.0311 |
0.000*** |
|
DSO² |
−0.00319 |
0.000456 |
0.000587 |
0.000*** |
|
Estimated optimum (DSO*) |
53.4 days |
|||
|
R² / Adjusted R² |
0.0461 / 0.0262 |
|||
|
Durbin-Watson |
0.303 |
|||
|
N |
50 quarters |
Note. *** p < 0.01. The OLS estimates were derived using EViews 12. HAC standard errors apply the Newey-West (1987) method with automatic bandwidth selection. The optimal estimation for DSO* is calculated as follows: DSO*= −0.3407 / (2 × −0.00319) = 53.4 days.
The energy sector model demonstrates the most precisely estimated nonlinearity in the dataset, as both linear and quadratic terms remain significant at the 1% level with HAC correction (p < 0.001). This provides the strongest statistical support for H1. The magnitude of the t-statistics, specifically, HAC-corrected t ≈ 10.9 for DSO and t ≈ −5.4 for DSO², remains sufficiently high to ensure that significance persists despite any reasonable inflation of standard errors due to autocorrelation correction. The optimum value of 53.4 DSO days aligns with the billing and collection cycle conventions prevalent in Peru’s regulated power sector. Under the OSINERGMIN regulatory framework, residential customers receive invoices with 30-day payment windows, while industrial clients typically negotiate terms of 45 to 60 days. Allowing collections to extend beyond 53 days indicates potential payment disputes, increases bad-debt exposure, and imposes a drag on financing costs that outweighs any potential relationship-building benefits.
4.2.3. Food and Beverage sector
In the food and beverage sector, Days Payable Outstanding (DPO) — rather than Inventory Days (ID) or Days Sales Outstanding (DSO) — serves as the primary driver of working capital. The quadratic term for DPO was not statistically significant (p = 0.47), indicating a linear relationship within the observed range: each additional day of extended supplier payments results in a positive and statistically significant increase in ROA. Table 6 provides the linear OLS estimates along with HAC standard errors.
Table 6
Linear OLS estimates — food and beverage sector (dependent variable: ROA)
|
Variable |
Coefficient |
OLS Std. |
HAC Std. |
p-value |
|---|---|---|---|---|
|
DPO |
0.1683 |
0.0068 |
0.0094 |
0.000*** |
|
Constant |
−1.794 |
0.936 |
1.187 |
0.138 |
|
R² / Adjusted R² |
0.8541 / 0.8514 |
|||
|
F-statistic (p-value) |
280.7 (0.000) |
|||
|
Durbin-Watson |
1.112 |
|||
|
N |
50 quarters |
Note. *** p < 0.01. The OLS estimates were obtained using EViews 12, with HAC standard errors based on Newey-West (1987) and automatic bandwidth selection. The quadratic term DPO² was tested and determined to be statistically insignificant (p = 0.47), thereby supporting the validity of the linear specification. The constant is included in all specifications. The DPO coefficient of 0.1683 indicates that each additional day of supplier payment extension corresponds to a 0.168 percentage point increase in ROA, net of the constant term.
The adjusted R² of 0.85, indicating that DPO alone explains 85.1% of the variability in ROA, represents — the highest single-variable explanatory power reported in the published WCM literature to date. This result remains statistically significant after HAC correction (HAC SE = 0.0094 vs. OLS SE = 0.0068), confirming that autocorrelation does not affect the finding. The Durbin-Watson statistic of 1.112 suggests moderate rather than severe autocorrelation, which aligns with the smooth trend driven by the dominant firm in the sector. This outcome reflects the structural dominance of the leading firm, which operates with an average DPO of 131 days and generates a negative CCC of −32 days. This mechanism is consistent with the analysis by Petersen and Rajan (1997), which describes how an oligopsonistic buyer converts supplier relationships into an interest-free revolving credit facility when alternative financing costs are positive and the outside options for suppliers are limited.
4.2.4. Commerce sector
The commerce sector shows a positive and statistically significant linear relationship between ID and ROA (β₁ = 0.036, p < 0.01 with HAC correction), whereas the quadratic term is not statistically significant (β₂ = −3.10×10⁻⁵, p = 0.46). An adjusted R² of 0.310 represents the highest value among single-sector quadratic/linear models, indicating that inventory investment accounts for approximately 31% of the variability in ROA within this sector. This finding regarding the positive relationship between inventory and ROA contradicts the conventional WCM prescription and aligns with the service-level logic in retail. For heavy machinery distributors and supermarket operators, product availability serves as the primary driver of revenue. Furthermore, stockout costs —comprising lost transactions and the risk of permanent customer defection— exceed holding costs across the observed range, thereby enhancing the value of inventory investment.
4.3. BVL Aggregate Model
Table 7 presents the results of the BVL aggregate model for both the quadratic DSO and linear DPO specifications. The analysis reports all standard errors with HAC correction applied.
Table 7
BVL aggregate OLS estimates with HAC standard errors: DSO and DPO models (dependent variable: ROA)
|
Variable |
Coefficient |
OLS Std. |
HAC Std. |
p-value |
|---|---|---|---|---|
|
Panel A: |
||||
|
DSO |
0.5858 |
0.1102 |
0.1498 |
0.001*** |
|
DSO² |
−0.00773 |
0.00465 |
0.00631 |
0.228 |
|
Inflection point (DSO*) |
~37.9 days |
|||
|
R² / Adjusted R² |
0.1252 / 0.1070 |
|||
|
Durbin-Watson |
0.514 |
|||
|
Panel B: |
||||
|
DPO |
0.1403 |
0.0348 |
0.0512 |
0.009*** |
|
n (both models) |
50 quarters |
Note. *** p < 0.01. The OLS estimates were generated using EViews 12; employing HAC standard errors with an automatic Newey-West bandwidth. The analysis indicates that the quadratic DSO term is not significant at the 5% level (HAC p = 0.228), thus rendering the inflection point at approximately 37.9 days merely indicative. Furthermore, the DPO coefficient substantiates the positive impact of payables at the aggregate market level.
At the BVL aggregate level, the linear DSO coefficient (β₁ = 0.586, p < 0.001 HAC) suggests that firms with longer receivables cycles achieve higher average ROAs. However, this effect likely reflects the cross-sector composition rather than a universal benefit of extending collection periods. The quadratic DSO term (β₂ = −0.00773, p = 0.228 HAC) does not reach significance at conventional levels, indicating that the observed aggregate nonlinear pattern primarily arises from sector heterogeneity rather than a consistent inverted-U relationship. Additionally, the DPO coefficient (0.140, p < 0.01 HAC) substantiates the positive effect of payables at the aggregate market level.
Table 8
Summary: sector-specific optimal WCM thresholds and model fit
|
Sector |
Dominant |
Relationship form |
Optimal |
Adj. R² |
Mean |
|---|---|---|---|---|---|
|
Food & Beverage |
DPO |
Linear (positive) |
Maximize DPO |
0.851 |
20.89 |
|
Electric Energy |
DSO |
Concave ( |
53.4 days |
0.026 |
8.87 |
|
Mining |
ID |
Concave ( |
65.4 days |
0.032 |
8.41 |
|
Commerce |
ID |
Linear (positive) |
Maximize ID |
0.310 |
3.19 |
|
BVL aggregate |
DSO / DPO |
Weak concave (DSO) |
~38 days (DSO) |
0.107 |
10.34 |
Note. The dominant lever is defined as the CCC component that exhibits the highest explanatory power during the linear stage. A concave () relationship denotes a negative β₂ that is statistically significant at the ≤ 5% (using HAC). In contrast, a linear relationship indicates that β₂ is not statistically significant at 5% level. All p-values are calculated based on Newey-West HAC standard errors.
5. DISCUSSION
This study makes three principal contributions to the literature on working capital management (WCM), each of which is discussed in relation to existing evidence and theory below.
First, the study confirms the statistically significant concave relationships in the mining and energy sectors, which were robust to the Newey-West HAC correction. This extends the inverted-U hypothesis proposed by Baños-Caballero et al. (2010) and Anton and Afloarei Nucu (2021) to a relatively under-researched Latin American context. The specific optima identified —65.4 ID days for mining and 53.4 DSO days for energy— reflect the unique operating realities at the sector level that generic financial theories fail to accommodate. Mining firms listed on the Bolsa de Valores de Lima (BVL) operate with high capital intensity and lengthy production cycles, which necessitate moderate inventory buffers that are operationally necessary and value-adding up to the identified threshold. In the energy sector, the optimum is influenced by billing and collection cycle conventions embedded within Peru’s regulated tariff structure governed by OSINERGMIN. These contextual observations highlight the necessity for sector-specific benchmarks rather than standardized prescriptions for reducing the cash conversion cycle (CCC), aligning with the contingency perspective advocated by Muñoz Mendoza et al. (2019) and the heterogeneity argument presented by Baker et al. (2023).
Second, the exceptional explanatory power of the DPO linear model within the food sector (adjusted R² = 0.851, robust to HAC correction) warrants deeper examination. Standard WCM models typically report R² values ranging from 0.05 to 0.35 for single-variable specifications (Deloof, 2003; García-Teruel & Martínez-Solano, 2007). The magnitude of the R² value observed in this context indicates the structural dominance of the sector’s leading firm and its capability to transform supplier relationships into a strategic financing instrument, aligning with the findings of Petersen and Rajan (1997) and Stavropoulos and Zounta (2025). However, this observation also highlights a systemic concern: the sector’s profitability is disproportionately reliant on the negotiating leverage of a single dominant buyer, thereby introducing fragility that is susceptible to potential supply chain regulation or disruption. Peru currently lacks the supply chain payment regulatory frameworks established in the European Union (the Late Payment Directive) and the United Kingdom (the Prompt Payment Code). The empirical evidence presented here supports a policy discussion regarding the necessity of such regulatory frameworks in the Peruvian context.
Third, the positive relationship between inventory and return on assets (ROA) in the commerce sector critically challenges the conventional recommendation to minimize inventory levels. From a service-level perspective, maintaining high product availability emerges as a competitive necessity in the retail sector. For companies such as InRetail Peru Corp., which operates supermarkets and pharmacies, and Ferreyros, which specializes in heavy machinery distribution, the costs associated with stockouts — including lost transactions and permanent customer defection — can surpass holding costs within the observed range, thereby enhancing the value of inventory investment. This finding supports the argument for heterogeneity presented by Baker et al. (2023) and warns against the uncritical application of universal prescriptions to reduce CCCs in retail and distribution contexts.
From a theoretical perspective, the findings advance the liquidity–profitability framework by identifying three distinct profitability architectures among BVL-listed firms. These architectures are: nonlinear with a well-defined interior optimum observed in the mining and energy sectors; linear with a dominant single lever prevalent in the food and commerce sectors; and mixed, exhibiting weak nonlinearity at the aggregate level. This typology necessitates the integration of sector-contingency factors into WCM models — a research initiative that has gained prominence in developed-market contexts (Aktas et al., 2015; Baker et al., 2023) but remains empirically underdeveloped in Latin American emerging markets. The low adjusted R² values in mining (0.032) and energy (0.026) should not be taken as undermining the significance of the quadratic coefficients. In single-regressor quadratic models, the t-statistics effectively test the explanatory contribution of specific nonlinear terms, whereas R² captures the total explained variation across all potential determinants. These statistics should be viewed as complementary rather than competing statistics.
6. CONCLUSION
This study presents the first sector-differentiated, long-span econometric analysis of working capital management (WCM) and profitability for firms listed on Peru’s Lima Stock Exchange, utilizing quarterly time series spanning from Q1 2011 to Q2 2023. The analysis yielded three principal conclusions.
First, optimal working capital thresholds exist and can be empirically measured for BVL-listed firms. In the mining sector, the return on assets (ROA) reaches its maximum at approximately 65.4 inventory days, while in the electric energy sector, the peak occurs at approximately 53.4 receivables days. These sector-calibrated thresholds substantiate the nonlinearity hypothesis (H1) in a Latin American emerging-market context, are robust to the Newey-West HAC correction, and provide actionable financial management benchmarks for practitioners in their respective sectors.
Second, the payables channel predominates WCM within concentrated industries. In the food and beverage sector, a linear DPO model accounts for 85.1% of the variability in ROA. This finding indicates the structural market power of Peru’s leading beverage producer within its supply chain, thereby advancing the trade credit literature. It emphasizes that supplier relationship management can constitute the most significant working capital decision in oligopsonistic industries (H3 confirmed). Additionally, this finding has regulatory implications, as the absence of a late-payment directive in Peru allows dominant buyers to impose financing terms on suppliers that would be restricted under EU or UK frameworks.
Third, no universal prescription for WCM exists. The four analyzed sectors display four distinct profitability architectures (H2 confirmed), thus refuting the uniform CCC-minimization prescription prevalent in earlier empirical literature. Effective WCM policy must account for sectoral operating cycles, competitive structures, and supplier bargaining power, necessitating sector-specific designs.
This study acknowledges four principal limitations. First, despite employing static ordinary least squares (OLS) with Newey-West HAC standard errors, the analysis does not fully address endogeneity arising from reverse causality between working capital and profitability. Future research utilizing instrumental variables or dynamic panel GMM estimation (Arellano & Bond, 1991) at the firm level can yield stronger causal identification. Second, the single-regressor specification omits control variables that are standard in the WCM literature, including financial leverage, firm size, sales growth, and macroeconomic conditions (e.g., commodity price indices, exchange rates, and interest rates). Third, the market-capitalization-weighted aggregation implies that sector findings primarily reflect the financial behavior of the dominant firm within each sector, limiting the generalizability of results to smaller listed firms or unlisted SMEs. Lastly, the DPO formula uses Net Sales as the denominator rather than the cost of goods sold (COGS), which may overstate absolute DPO levels in high-margin sectors. Future research should concurrently apply all four corrections — firm-level panel data, GMM estimation, a comprehensive control-variable specification, and a COGS-based DPO formula — to produce fully robust and causally interpretable WCM estimates for Peruvian listed firms.
Declaration on the use of AI and AI-assisted technologies in the writing process
In the preparation of this work, the authors employed AI-assisted writing tools to enhance language clarity, structural organization, and readability. Subsequent to using these tools, the authors meticulously reviewed and edited the content as necessary, take full responsibility for the content of the publication. The authors did not use AI tools to generate original analyses, econometric estimates, data interpretations, or research conclusions. All empirical results were exclusively produced by the authors using EViews 12.
Acknowledgements
[Acknowledgements are provided in the Title Page file and will be restored in the accepted manuscript, in compliance with double-blind review requirements.]
Funding: This research did not receive specific funding from any agency in the public, commercial, or non-profit sectors.
Data availability: The quarterly financial data were sourced from Economática (2024), a licensed commercial database. Upon reasonable request, the corresponding author can provide access to aggregated sector-level series, subject to the licensing terms established by the data provider.
REFERENCES
Aktas, N., Croci, E., & Petmezas, D. (2015). Is working capital management value-enhancing? Evidence from firm performance and investments. Journal of Corporate Finance, 30, 98-113. https://doi.org/10.1016/j.jcorpfin.2014.12.008
Almonacid, L.. (2022). Capital de trabajo y rentabilidad de las empresas que componen el Índice S&P/BVL Perú General en el contexto del COVID-19. [Bachelor thesis, Universidad Continental]. Repositorio Institucional Continental. https://repositorio.continental.edu.pe/handle/20.500.12394/12208
Anton, S. G., & Afloarei Nucu, A. E. (2021). The impact of working capital management on firm profitability: Empirical evidence from the Polish listed firms. Journal of Risk and Financial Management, 14(1), 9. https://doi.org/10.3390/jrfm14010009
Arellano, M., & Bond, S. (1991). Some tests of specification for panel data: Monte Carlo evidence and an application to employment equations. Review of Economic Studies, 58(2), 277-297. https://doi.org/10.2307/2297968
Baker, H. K., Filbeck, G., & Barkley, T. (Eds.). (2023). Working capital management: Concepts and strategies. World Scientific Publishing Co. Pte. Ltd. https://doi.org/10.1142/12929
Baños-Caballero, S., García-Teruel, P. J., & Martínez-Solano, P. (2010). Working capital management in SMEs. Accounting and Finance, 50(3), 511-527. https://doi.org/10.1111/j.1467-629X.2009.00331.x
Baños-Caballero, S., García-Teruel, P. J., & Martínez-Solano, P. (2014). Working capital management, corporate performance, and financial constraints. Journal of Business Research, 67(3), 332-338. https://doi.org/10.1016/j.jbusres.2013.01.016
Brealey, R., Myers, S., & Allen, F. (2020). Principles of corporate finance. McGraw-Hill Education
Cuñat, V. (2007). Trade credit: Suppliers as debt collectors and insurance providers. The review of Financial Studies, 20(2), 491-527. https://doi.org/10.1093/rfs/hhl015
Deloof, M. (2003). Does working capital management affect profitability of Belgian firms? Journal of Business Finance and Accounting, 30(3-4), 573-588. https://doi.org/10.1111/1468-5957.00008
Díaz Ortega, N. I., Cudris Niño, L. F., & García Mogollón, J. M. (2024). Gestión del capital circulante y la rentabilidad: un análisis bibliométrico e identificación de tendencias. Ingeniería Solidaria, 20(3), 1-19. https://doi.org/10.16925/2357-6014.2024.03.05
Economática. (2024). Financial data platform [Data set]. Economática. https://www.economatica.com
García-Teruel, P. J., & Martínez-Solano, P. (2007). Effects of working capital management on SME profitability. International Journal of Managerial Finance, 3(2), 164-177. https://doi.org/10.1108/17439130710738718
Lazaridis, I., & Tryfonidis, D. (2006). Relationship between working capital management and profitability of listed companies in the Athens Stock Exchange. Journal of Financial Management and Analysis, 19(1). https://papers.ssrn.com/sol3/papers.cfm?abstract_id=931591.
Muñoz Mendoza, J. A., Sepúlveda Yelpo, S. M., Veloso Ramos, C. L., & Delgado Fuentealba, C. L. (2019). Examining the effect of corporate and capital structure on operational efficiency in Chilean firms. RAN. Revista Academia & Negocios, 5(1), 109-122. https://revistas.udec.cl/index.php/ran/article/view/2586
Newey, W. K., & West, K. D. (1987). A simple, positive semi-definite, heteroskedasticity and autocorrelation consistent covariance matrix. Econometrica, 55(3), 703-708. https://doi.org/10.2307/1913610
Newey, W. K., & West, K. D. (1994). Automatic lag selection in covariance matrix estimation. Review of Economic Studies, 61(4), 631-653. https://doi.org/10.2307/2297912
Petersen, M. A., & Rajan, R. G. (1997). Trade credit: Theories and evidence. Review of Financial Studies, 10(3), 661-691. https://doi.org/10.1093/rfs/10.3.661
Prais, S. J., & Winsten, C. B. (1954). Trend estimators and serial correlation (Cowles Commission Discussion Paper No. 383). Cowles Commission for Research in Economics. https://cowles.yale.edu/sites/default/files/2023-05/s-0383.pdf
Richards, V. D., & Laughlin, E. J. (1980). A cash conversion cycle approach to liquidity analysis. Financial Management, 9(1), 32-38. https://doi.org/10.2307/3665310
Ross, S. A., Westerfield, R. W., & Jaffe, J. F. (2019). Corporate finance (12th ed.). McGraw-Hill Education.
Ruiz Del Castillo, Z., & Valdivia Magallan, O. (2023). Capital de trabajo y rentabilidad de las empresas peruanas [Licenciatura thesis, Universidad Peruana Unión]. Repositorio Institucional UPEU. https://hdl.handle.net/20.500.12840/6932
Shin, H. H., & Soenen, L. A. (1998). Efficiency of working capital management and corporate profitability. Financial Practice and Education, 8(2), 37-45.
Stavropoulos, A-S., & Zounta, S. (2025). Cash conversion cycle and profitability: Evidence from Greek service firms. Journal of Risk and Financial Management, 18(4), 208. https://doi.org/10.3390/jrfm18040208