Dynamic Malware Analysis Using Machine
Learning-Based Detection Algorithms
Erly Galia Villarroel Enriquez
ORCID: 0000-0001-8566-0494
Facultad de Ingeniería, Universidad de Lima
Juan Gutiérrez-Cárdenas
ORCID: 0000-0003-2566-4690
Facultad de Ingeniería, Universidad de Lima
Received: May 10th, 2024 / Accepted: June 8th, 2024
doi: https://doi.org/10.26439/interfases2024.n19.7097
ABSTRACT. With the increasing popularity of cell phone use, the risk of malware infections on such devices has increased, resulting in financial losses for both individuals and organizations. Current research focuses on the application of machine learning for the detection and classification of these malware programs. Accordingly, the present work uses the frequency of system calls to detect and classify malware using the XGBoost, LightGBM and random forest algorithms. The highest results were obtained with the LightGBM algorithm, achieving 94,1 % precision and 93,9 % accuracy, recall, and F1-score, demonstrating the effectiveness of both machine learning and dynamic malware analysis in mitigating security threats on mobile devices.
KEYWORDS: malware / machine learning / detection
Análisis dinámico de malware mediante algoritmos de detección basados en machine learning
RESUMEN. Con la creciente popularidad del uso de teléfonos celulares, el riesgo de infecciones por malware en dichos dispositivos ha aumentado, lo que genera pérdidas financieras tanto para individuos como para organizaciones. Las investigaciones actuales se centran en la aplicación del aprendizaje automático para la detección y clasificación de estos programas malignos. Debido a esto el presente trabajo utiliza la frecuencia de llamadas al sistema para detectar y clasificar malware utilizando los algoritmos XGBoost, LightGBM y random forest. Los resultados más altos se obtuvieron con el algoritmo de LightGBM, logrando un 94.1% de precisión y 93.9% tanto para exactitud, recall y f1-score, lo que demuestra la efectividad tanto del uso del aprendizaje automático como del uso de comportamientos dinámicos del malware para la mitigación de amenazas de seguridad en dispositivos móviles.
PALABRAS CLAVE: malware / machine learning / detección
1. INTRODUCTION
According to the FortiGuard Labs threat report (Fortinet, 2022) for Latin America and the Caribbean, cyberattack attempts surged by 600 % in 2021 compared to 2020, constituting 10 % of the total global attempts. FortiGuard Labs, Fortinet’s threat intelligence laboratory, also noted that Peru was the third most targeted country, with 11,5 billion attack attempts, following Mexico and Brazil.
Duo et al. (2022) argue that cyberattacks pose security challenges in cyber systems, potentially affecting system performance or causing additional damages. These attacks can take various forms, including denial of service, phishing, or malware.
Several authors (Saravia et al., 2019, as cited in Ashik et al., 2021) define malware as malicious software embedded in lawful programs to perform criminal activities. With the rapid spread of the Internet and the proliferation of connected devices, malware attacks have increased significantly, jeopardizing user privacy.
Regarding the causes of malware infections, Ashik et al. (2021) point out that these are primarily due to the download of free software such as games, web browsers, or free antivirus programs. Three common methods by which malware can infiltrate a device are highlighted: download attack, where malware is hosted on a web server to infect devices visiting the page; update attack, which modifies a benign application to include malware characteristics; and repackaging attack, where malware is embedded in a benign application (Felt et al., 2014, as cited in Surendran & Thomas, 2022).
Current research focuses on enhancing malware detection through machine learning algorithms. For instance, Mahindru and Sangal (2020) developed a framework to safeguard Android devices using a dataset containing benign and malicious samples of Android Package Kit (APK) files collected from sources including Google Play Store, Android, Panda.App, among others. They employed a feature selection approach, extracting specific application features (permissions, system calls, number of app downloads, and app ratings) for model training using various machine learning algorithms such as logistic regression, support vector machines (SVM), or random forest (RF), to compare them with existing models trained on all APK file characteristics. They found that models employing a feature selection approach outperformed those using the entire set of extracted features.
The selection of dataset features to be used as input for machine learning models is also crucial, as noted by Wu et al. (2021). Their study focused on devising why an application is classified as malware by machine learning algorithms, using application programming interface (API) calls and permissions from APK files. The dataset collected by the authors consisted of 20 120 benign applications and 15 570 malicious apps. They found that these two characteristics alone are insufficient to fully explain malware behavior.
Surendran and Thomas (2022) proposed a novel malware detection system in Android using graph centrality measures composed of system calls from APK applications. The RF algorithm exhibited the highest performance, with 0,98 accuracy for detecting obfuscated malware. Additionally, they suggested further research to reduce false positive rate (when an application is incorrectly classified as malware).
For this study, a data science approach will be adopted, utilizing the RF, XGBoost, and LightGBM algorithms, which have been employed in recent research. Louk and Tama (2022) applied these algorithms to efficiently detect malware, achieving precision and accuracy above 99,2 % for all three algorithms.
Based on the algorithms currently used in the field of data science, the goal of our present study is to evaluate the effectiveness of machine learning algorithms such as RF, LightGBM, or XGBoost on the CICMalDroid 2020 dataset, which utilizes dynamically observed malware behaviors (actions performed by malware while in execution) to identify the most suitable model for preventing malware cyberattacks.
This article is organized as follows: Section 2 presents a survey of experimental studies on major malware detection techniques and machine learning algorithms to be trained for malware detection scenarios. Section 3 discusses the methodology and describes the dataset employed. Section 4 presents the experimentation, followed by the results in Section 5. Section 6 provides discussions and finally Section 7 presents the conclusions and future works.
2. BACKGROUND
There are two main techniques for analyzing malware: static and dynamic analysis. The former involves analyzing malware without executing it (Alosefer Y., 2012, as cited in Aslan & Samet, 2020), while the latter involves analyzing malware as it runs in a real or virtual environment (Bhat & Dutta, 2019, as cited in Liu et al., 2020). For the present study, malware execution will not be performed directly; instead, a dataset where dynamic analysis was previously conducted will be employed.
2.1 Dynamic Analysis
Surendran et al. (2020) claim that to detect malicious activity, dynamic analysis predominantly considers data originating from the running application, including system call traces and sensitive API calls. It is worth noting that system calls contain more relevant information about malware behavior compared to API calls, as misclassifications can occur when a benign application invokes API calls frequently used in malicious applications. The authors conclude that certain types of legitimate applications, such as face detection or weather prediction apps, request more system privileges during execution. In such cases, these benign apps may generate system calls that resemble those found in malware apps, potentially causing these goodware apps to be mistakenly flagged as malware. To reduce these false positives, the authors suggest future research should consider both the timing and frequency of malicious system calls in an application.
Feng et al. (2018) highlight that system calls indicate how applications request services from the operating system to perform important functions such as power management, device security, and hardware resource access, among others. However, they can also be used for malicious purposes; the authors note that malware tends to use more system calls than benign applications. Examples of such system calls include syscall operations like “fork,” “fchmod,” and “wait4,” which indicate changes in file ownership containing sensitive information or the creation of child processes to perform hidden malicious behavior. The authors conclude that despite the effectiveness of their dynamic analysis framework called EnDroid, which extracts system-level behavior traces and common application-level malicious behaviors, it is necessary to improve the coverage of the dynamic analysis for future research.
Surendran and Thomas (2022) focused on tracking system calls to detect malicious activity in applications, noting that malware applications automatically invoke sensitive APIs (such as making calls) to execute privileged actions like collecting information from contacts. For their research, they first gathered system call traces and organized them into an ordered graph where system calls are vertices and their edges represent adjacency relations. This ordered graph enables the extraction of central values from the system call graph, such as “rename” and “open” system calls, using centrality measurements like eigenvector, betweenness, and closeness. The authors concluded that their proposed system outperforms existing malware detection mechanisms based on system calls with an accuracy of 0,99. However, they noted the necessity of using new tools for collecting system calls from malware applications. Due to the mechanism employed by the authors, some malware apps did not exhibit malicious behavior during the collection of syscall traces because of the limited code coverage problem in automated test case generation tools like monkeyrunner.
As a result of the review, some gaps were identified like the necessity of using new tools for collecting system calls, improving the coverage of dynamic analysis, and considering the frequency of occurrence of system calls when analyzing malware applications. Therefore, in this article, we will use a dataset that includes the number of occurrences of dynamic malware behaviors and has been processed with a tool that adequately reconstructs them.
2.2 Supervised Machine Learning Techniques for Malware Detection
Several authors have employed machine learning algorithms to detect malware, utilizing feature extraction from various datasets. The most relevant works reviewed are mentioned below.
Aebersold et al. (2016) used RF and SVM algorithms on three different datasets: the first consisting of the complete list of JavaScript samples available on jsDelivr (a content delivery network for open-source projects), the second including the Top 500 Alexa websites (a page collecting information from websites), and the third consisting of a set of malicious JavaScript samples gathered from the Swiss Reporting and Analysis Centre for Information Assurance (MELANI). All precision scores were above 99 %. The authors concluded that a more representative dataset is needed to perform malware detection because the dataset of malicious scripts they used was much smaller than the dataset of benign scripts, making it unclear whether the classifier is capturing the actual syntactic characteristics correlated with the malicious behavior.
Chen et al. (2018) also used RF and SVM, as well as k-nearest neighbors (KNN), and applied them to a dataset they collected. The authors focused on two metrics, false negatives, and accuracy, concluding that the best algorithm was RF with an accuracy of 96,35 % and a false negative rate of 2,50 % (the lowest among the three algorithms applied).
Another example of using RF and SVM algorithms is provided by Kim et al. (2018), who collected macro applications in Excel and Word, then extracted 15 characteristics from them, such as the number of characters in the code (excluding comments) and average word length. The models employed ranged from SVM, multi-layer perceptron (MLP), or RF, resulting in relatively good performance. RF achieved a precision of 98,2 %, SVM achieved 88,1 %, and MLP achieved 93,8 % in the same metric.
Choudhary and Sharma (2020) also applied these machine learning algorithms—using datasets from other authors to evaluate malware detection with KNN, SVM, decision tree, and MLP—obtaining accuracies higher than 87 %, 89 %, 92 %, and 90 %, respectively. They concluded that machine learning algorithms have greater potential for malware detection compared to traditional techniques employed by current antivirus software (signature analysis).
Current research reflects the use of new machine learning algorithms for both detection and classification compared to past research. Chen et al. (2021) used the LightGBM algorithm on the Drebin dataset, using the frequency of API calls made by APK files within the dataset and achieved an accuracy of 99,54 %. Other works that used LightGBM include those by Gao et al. (2022), Onoja et al. (2022), and Chen et al. (2023).
New algorithms were also employed by Urooj et al. (2022), who collected 56 000 features from 100 000 Android applications using static analysis. For feature extraction, they used Androguard and performed feature selection to reduce the number of features, then input them into machine learning models such as KNN, naive Bayes (NB), radial basis function (RBF), decision tree, SVM, and AdaBoost with decision trees. They achieved an accuracy of 96,26 % with the AdaBoost model and a false positive rate of 0,3 %. The authors concluded that ensemble and strong learner algorithms perform comparatively better when dealing with classifications and high-dimensional data. They also highlighted that their research approach was restricted in terms of static analysis, thus it is important to use a dataset with dynamic features for future research.
Şahın et al. (2022) used algorithms such as KNN, NB, RBF, decision tree, SVM, and linear methods like Linear Regression, obtaining the best result from the combination of SVM and decision trees, with an F-measure of 96,95 % for the AMD dataset. They concluded that the application of popular classification algorithms positively benefits malware classification. However, they noted that their static analysis approach used APK permissions as features, emphasizing the need to expand the research using dynamic behaviors of malware.
Palsa et al. (2022) used the XGBoost algorithm to detect malware in a dataset they collected through VirusShare, achieving 96,54 % accuracy using dynamic analysis features. Other authors who used the XGBoost algorithm include Dhamija and Dhamija (2021) and Kumar and Geetha (2020), who efficiently detected and classified malware with this novel algorithm. They concluded that the use of machine learning algorithms potentially benefits the detection of malicious software.
Finally, Louk and Tama (2022) applied RF, XGBoost, CatBoost, gradient boosting machine (GBM), and LightGBM algorithms to three different datasets containing features of malware that could be run portably (portable executable [PE] files) on Windows, obtaining precision and accuracy results above 99,2 % for both metrics. They concluded that the algorithms that performed best are those based on decision trees, with performance differences between algorithms being not statistically significant.
As a result of the literature review on machine learning models used for malware detection, it is evident that the most recent studies indicate the need to expand research using dynamic behaviors. It is also noted that the best-performance algorithms are those using decision trees (including RF), XGBoost, and LightGBM (a variation of gradient boosting to make it more efficient). This research will therefore experiment with these three models.
3. METHODOLOGY
This research proposes a methodology based on comparing machine learning algorithms applied to the detection and classification of malware families, specifically RF, LightGBM, and XGBoost. These algorithms will be applied to the CICMalDroid 2020 dataset, as described in the Experimentation section. Figure 1 presents the block diagram outlining the activities to be carried out in the experimentation.
Figure 1
General Overview of the Proposed Approach
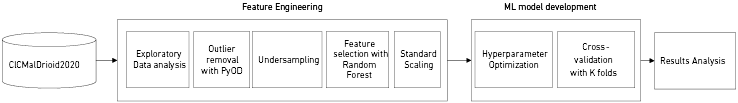
Below is a brief explanation of the methodology:
1. Acquisition of Dataset With System Call Frequencies
The chosen dataset for this research was CICMalDroid 2020—developed by Mahdavifar et al. (2020)—which contains the elements outlined in Table 1. It is important to emphasize that this research will only use the ‘feature_vectors_syscallsbinders_frequency_5_Cat.csv’ file. This dataset was generated through dynamic analysis using the CopperDroid tool, a system based on virtual machine introspection (VMI) that automatically reconstructs specific low-level Android behaviors and specific operating system activities from Android samples. According to the authors, out of 17 341 Android samples, only 13 077 executed successfully while the remainder failed due to issues such as timeouts, invalid APK files, and memory allocation difficulties. Additionally, 12 % of the JSON files (CopperDroid output results in this format) from the successful executions were not uploaded to the Canadian Institute for Cybersecurity website—where the CICMalDroid 2020 dataset is stored—due to “unfinished strings” (records that should be in double quotes but lack a closing quote).
2. Feature Engineering
An exploratory data analysis was performed to ensure that the dataset does not contain null values. Given that the dataset is imbalanced, undersampling will be employed to balance the number of records. The most relevant features will be selected using the RF algorithm to determine the relative importance of each feature in predicting the target. The final dataset will be standardized to equalize the scales of the numbers before being used in the model building process.
3. Application of Machine Learning Models (XGBoost, LightGBM, RF)
Cross-validation with grid search will be employed to select the best hyperparameters for the machine learning models. Subsequently, the models will be executed using k-folds cross-validation, and metrics such as accuracy, precision, and F1-score will be obtained for each model, in addition to the confusion matrix.
4. Results Analysis
For the analysis of the results, precision and recall metrics will be employed as they are effective to compare multi-class datasets. The results obtained will be compared with previous research that used the same dataset or datasets that included only system call frequencies. Possible reasons for differences in results will be discussed.
4. EXPERIMENTATION
4.1 Description of the Dataset Employed in the Experimentation Section
The components of the CICMalDroid 2020 dataset are described in Table 1.
Table 1
Description of the Components of the CICMalDroid 2020 Dataset
|
Component |
Description |
|
APK Files |
17 341 Android samples categorized into five groups: riskware, banking malware, benign samples, SMS malware, and adware. |
|
Capturing Logs |
13 077 samples were analyzed and the results were categorized into five groups: riskware, banking malware, SMS malware, adware, and benign samples. |
|
Comma-Separated Values (CSV) Files |
‘feature_vectors_syscallsbinders_frequency_5_Cat.csv’:
|
Note. These components and their descriptions were derived from research by Mahdavifar et al. (2020). The CSV files and dataset components were downloaded from the Canadian Institute for Cybersecurity website1. The ‘.csv’ file that will be used for the creation of machine learning models in the Experimentation section is ‘feature_vectors_syscallsbinders_frequency_5_Cat.csv’2. The file contains 470 dynamically observed behaviors and their frequencies of occurrence during dynamic application analysis. The content of the extracted ‘.csv’ file is presented in Table 2, and the descriptions of the observed columns are presented in Table 3.
Table 2
Visualization of the First Five System Calls From the First Five Records Contained in the ‘feature_vectors_syscallsbinders_frequency_5_Cat.csv’ File With Their Respective Frequencies
|
ACCESS_PERSONAL_INFO___ |
ALTER_PHONE_STATE___ |
ANTI_DEBUG_____ |
CREATE_FOLDER_____ |
CREATE_PROCESS`_____ |
|
1 |
0 |
0 |
3 |
0 |
|
3 |
0 |
0 |
6 |
0 |
|
2 |
0 |
0 |
4 |
0 |
|
1 |
0 |
0 |
4 |
0 |
|
3 |
0 |
0 |
11 |
0 |
Table 3
Description of the First Row in Table 2
|
System Call Name |
Description |
|
ACCESS_PERSONAL_INFO___ |
Permits access to personal information |
|
ALTER_PHONE_STATE___ |
Modifies the phone’s state variable |
|
ANTI_DEBUG_____ |
Protects against debugging techniques |
|
CREATE_FOLDER_____ |
Creates a folder or directory |
|
CREATE_PROCESS`_____ |
Creates a new process |
4.2 Feature Engineering
The Google Colab programming environment was used, with Python as the programming language. For the removal of the most representative outliers, the PyOD library (a Python library for detecting outlier objects in multivariate datasets) was employed, utilizing the KNN class for outlier detection. According to the documentation of the PyOD KNN model, the distance to the nearest neighbor of an observation can be viewed as its outlying score. The model also includes a parameter called contamination, which represents the proportion of outliers in the dataset. For the purposes of this study, the contamination value of 0,02 was selected.
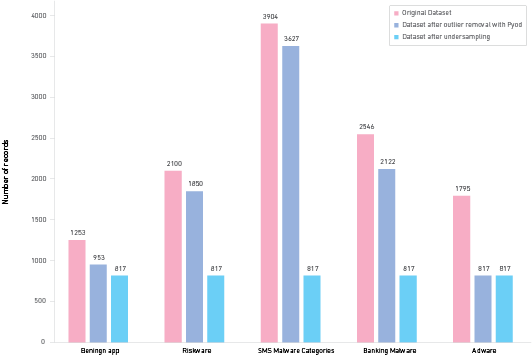
Subsequently, class balancing was performed using the imblearn library with the undersampling method. Figure 2 shows the comparison of the number of records in the original dataset and after processing with the PyOD library and class balancing with the imblearn library.
Figure 2
Comparison of the Number of Samples in the Original Dataset Versus the Processed Dataset
Finally, variable selection based on importance was conducted using the SelectFromModel3 library and the RF algorithm. This technique involves identifying the most relevant features in a dataset by assessing their importance scores. These scores are determined by the RF model, which evaluates how much each feature contributes to increasing or reducing impurity across all the trees in the forest.
To achieve this, various threshold values were tested to evaluate the models and compare accuracy metrics. The threshold corresponding to the best result in Table 4 was selected.
Table 4
Experimentation Carried Out With Different Thresholds to Determine Which Value to Choose
|
Threshold |
Number of Features |
Accuracy |
|
0,001 |
153 |
0,9204 |
|
0,002 |
127 |
0,9241 |
|
0,003 |
107 |
0,9216 |
|
0,004 |
89 |
0,9253 |
|
0,005 |
75 |
0,9192 |
|
0,006 |
62 |
0,9204 |
|
0,007 |
54 |
0,9228 |
|
0,008 |
49 |
0,9155 |
|
0,009 |
42 |
0,9228 |
|
0,01 |
34 |
0,9216 |
Since the threshold yielding the highest accuracy result is 0,004 (corresponding to an accuracy of 0,9253), a selection will be made of the 89 attributes whose importance values exceed the selected threshold.
5. Results
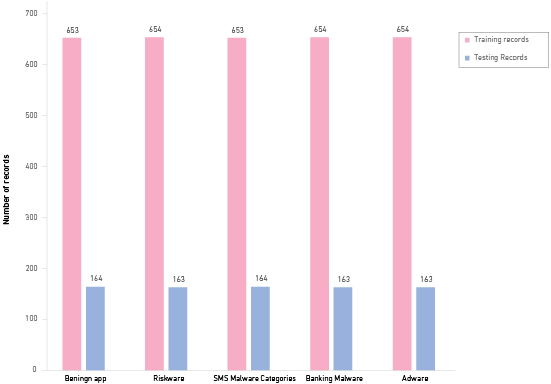
5.1 Training and Test Samples
Training with the machine learning models will use 80 % of the records, while the remaining 20 % will be allocated for testing purposes. Figure 3 illustrates the distribution of training and testing records for each category.
Figure 3
Comparison of the Number of Training and Testing Records
5.2 Machine Learning Models
Table 5 presents the results obtained for each algorithm, including their standard deviation across folds.
Table 5
Comparative Table of Precision, Recall, Accuracy, and F1-Score Results for Machine Learning Algorithms With Standard Deviation Across Folds
|
Algorithms |
Accuracy |
Precision |
Recall |
F1-Score |
|
Random Forest |
0,9356 ± 0,0140 |
0,9379 ± 0,0129 |
0,9356 ± 0,0140 |
0,9358 ± 0,0139 |
|
XGBoost |
0,9349 ± 0,0118 |
0,9362 ± 0,0111 |
0,9349 ± 0,0118 |
0,9350 ± 0,0116 |
|
Light GBM |
0,9395 ± 0,0105 |
0,9410 ± 0,0102 |
0,9395 ± 0,0105 |
0,9396 ± 0,0105 |
The data within Table 5 presents the precision, recall, accuracy, and F1-score outcomes achieved by three distinct machine learning algorithms: RF, XGBoost, and Light GBM. Despite relatively minor differences, Light GBM emerged as the top performer, attaining the highest accuracy of 0,9395 ± 0,0105, the highest precision score of 0,9410 ± 0,0102, and the highest recall rate of 0,9395 ± 0,0105. XGBoost followed closely with the second highest accuracy of 0,9349 ± 0,0118, the second best precision score of 0,9362 ± 0,0111, and the second best recall rate of 0,9349 ± 0,0118. RF trailed slightly behind, achieving an accuracy of 0,9356 ± 0,0140, a precision score of 0,9379 ± 0,0129, and a recall rate of 0,9356 ± 0,0140, which was the lowest among the three algorithms.
Figure 4
Confusion Matrix of the RF Algorithm After Applying Stratified K-Fold Cross-Validation (10 Folds)
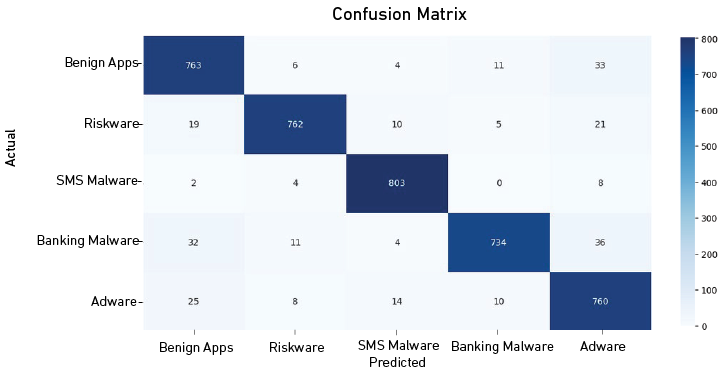
Or the Benign Apps class, the model achieved an excellent accuracy by correctly identifying 763 instances. However, it misclassified 6 instances as riskware, 4 as SMS malware, 11 as banking malware, and 33 as adware.
In the riskware class, the model accurately predicted 762 instances but misclassified 19 as benign apps, 10 as SMS malware, 5 as banking malware, and 21 as adware.
The model exhibited high accuracy for the SMS malware class, correctly classifying 803 instances. Misclassifications were minimal, with 2 instances classified as benign apps, 4 as riskware, and 8 as adware.
For banking malware class, the model correctly predicted 734 instances but misclassified 32 instances as benign apps, 11 as riskware, 4 as SMS malware, and 36 as adware.
Finally, the Adware class achieved high accuracy with 760 instances correctly classified. Misclassifications were relatively low, with 25 instances classified as benign apps, 8 as riskware, 14 as SMS malware, and 10 as banking malware.
Figure 5
Confusion Matrix of the XGBoost Algorithm After Applying Stratified K-Fold Cross-Validation
(10 Folds)

As shown in Figure 5, for the benign apps class, the model correctly identified 761 instances but misclassified 6 as riskware, 4 as SMS malware, 18 as banking malware, and 28 as adware.
In the riskware class, 758 instances were accurately predicted, while 20 were misclassified as benign apps, 10 as sms malware, 8 as banking malware, and 21 as adware.
The model exhibited a high accuracy for the SMS malware class, correctly classifying 799 instances, with relatively low misclassifications: 10 as riskware, 1 as banking malware, and 7 as adware.
For the banking malware class, 747 instances were accurately predicted, but 30 were misclassified as benign apps, 11 as riskware, 5 as SMS malware, and 24 as adware.
Finally, the adware class achieved high accuracy with 754 instances correctly classified. Misclassifications were relatively low: 24 as benign apps, 8 as riskware, 16 as SMS malware, and 15 as banking malware.
Figure 6
Confusion Matrix of the LightGBM Algorithm After Applying Stratified K-Fold Cross-Validation
(10 Folds)

As illustrated in Figure 6, for the benign apps class, the model correctly identified 765 instances but misclassified 6 as riskware, 3 as SMS malware, 16 as banking malware, and 27 as adware.
In the riskware class, 767 instances were accurately predicted, while 19 were misclassified as benign apps, 5 as SMS malware, 7 as banking malware, and 19 as adware.
The model exhibited high accuracy for the SMS malware class, correctly classifying 799 instances, with relatively low misclassifications: 1 as bening apps, 7 as riskware, 2 as banking malware, and 8 as adware.
For the banking malware class, 745 instances were accurately predicted, but 30 were misclassified as benign apps, 12 as riskware, 5 as SMS malware, and 25 as adware.
Finally, the adware class achieved high accuracy with 762 instances correctly classified and relatively low misclassifications: 27 as benign apps, 6 as riskware, 11 as SMS malware, and 11 as banking malware.
6. DISCUSSION
As detailed in the Results section, all models achieved weighted accuracies above 93 %, which are considered good overall. Furthermore, as observed in Table 5, the highest accuracy of 93,95 %, the best precision of 94,1%, and the best recall of 93,95 % were obtained with the LightGBM algorithm. These results could be attributed to the unique features of the LightGBM algorithm.
According to Ke et al. (2017), LightGBM is a decision tree-based model designed to work efficiently with large datasets. It employs a variant of the gradient boosting technique, focusing on leaf-wise tree growth, which improves its efficiency and scalability. Moreover, LightGBM utilizes advanced techniques like gradient-based one-side sampling (GOSS) and exclusive feature bundling (EFB). GOSS helps to reduce the variance of the model by focusing on instances with larger gradients, leading to more accurate predictions. EFB bundles mutually exclusive features, reducing the number of splits needed and improving computational efficiency. These features likely contributed to a better fit of the model to the data, avoiding issues such as overfitting and improving its generalization ability.
The processing of the CICMalDroid 2020 dataset showed different results compared to previous studies that employed the same dataset. For instance, Sönmez et al. (2021) used machine learning algorithms for malware family classification, achieving a maximum precision of 90,2 % and an average recall of 89,54 % with the KNN algorithm. In contrast, our study achieved a maximum precision of 94,1 % and a recall of 93,95 % with the LightGBM model. This variance can be explained by our use of Decision Tree-based and boosting algorithms, leading to better outcomes.
On the other hand, Bhatia and Kaushal (2017) researched malware detection using system call frequencies, achieving a precision of 88,9 %. In contrast, our study obtained a precision of 94,1 %. This discrepancy can be attributed to differences in dataset size; while the authors used 100 records, this research employed a dataset of 4 085 records. Additionally, the dataset employed in this research was processed using CopperDroid, a tool that enables high-level system call extraction in Android applications, whereas the authors used the “strace” command for their system call collection.
Kshirsagar and Agrawal (2022) focused their study on feature selection using methods traditionally employed in malware detection systems. They achieved a higher precision of 97,46 %; in contrast, our study achieved the highest precision of 94,1%. This difference in results can be attributed to the feature selection methods used. The authors selected 80 features from 470 original features by using the ReliefF method, which identifies the most relevant features in a dataset based on their ability to distinguish between instances from different classes. In contrast, our study employed 89 features obtained from SelectFromModel, a wrapper-based method that selects features based on their importance in a pre-trained machine learning model.
It should be noted that some limitations were found in this research: the impossibility of extracting the dynamic behaviors of the APKs with CooperDroid due to its discontinuation, which needed the use of the ‘.csv’ file mentioned in the Methodology section. It is also worth mentioning that the obtained data was unbalanced, as the class related to SMS malware was the majority class. Consequently, undersampling had to be performed, reducing the amount of data compared to the original records to achieve balance.
7. CONCLUSIONS AND FUTURE WORK
In the present research, the effectiveness of machine learning algorithms (RF, LightGBM, and XGBoost) was evaluated to identify the most appropriate model to prevent malware attacks, using a dataset of dynamically observed malware behaviors. The results indicate that the more data used to train the machine learning models, the better the classification between families. After preprocessing, 817 records per family were achieved, totaling 4 085 records. Increasing the amount of data is expected to have a positive impact by improving the accuracy rate.
Having compared the results of this study with previous research in the Discussion section, it is concluded that dynamically observed behaviors of malware can be successfully employed in malware family classification with the assistance of machine learning models. Dynamic behaviors offer a more detailed insight into malware characteristics, enabling a finer classification.
Finally, for future research, the plan is to expand the study by reducing the limitations discussed in the previous section, specifically by processing similar numbers of malware applications to avoid class imbalance. Likewise, we will seek to implement methodologies employed by different authors to reduce the rate of false positives in the classification.
REFERENCES
Aebersold, S., Kryszczuk, K., Paganoni, S., Tellenbach, B., & Trowbridge, T. (2016). Detecting obfuscated JavaScripts using machine learning. ICIMP 2016 the Eleventh International Conference on Internet Monitoring and Protection: May 22-26, 2016, Valencia, Spain, 1, 11–17. https://doi.org/10.21256/zhaw-3848
Ashik, M., Jyothish, A., Anandaram, S., Vinod, P., Mercaldo, F., Martinelli, F., & Santone, A. (2021). Detection of malicious software by analyzing distinct artifacts using machine learning and deep learning algorithms. Electronics, 10(14), 1694. https://doi.org/10.3390/electronics10141694
Aslan, Ö. A., & Samet, R. (2020). A comprehensive review on malware detection approaches. IEEE Access, 8, 6249-6271. https://doi.org/10.1109/ACCESS.2019.2963724
Bhatia, T., & Kaushal, R. (2017). Malware detection in android based on dynamic analysis. 2017 International Conference on Cyber Security and Protection Of Digital Services (Cyber Security), London, UK, 1-6. https://doi.org/10.1109/CyberSecPODS.2017.8074847
Chen, S., Xue, M., Fan, L., Hao, S., Xu, L., Zhu, H., & Li, B. (2018). Automated poisoning attacks and defenses in malware detection systems: An adversarial machine learning approach. Computers and Security, 73, 326-344. https://doi.org/10.1016/j.cose.2017.11.007
Chen, Y. C., Chen, H. Y., Takahashi, T., Sun, B., & Lin, T. N. (2021). Impact of code deobfuscation and feature interaction in android malware detection. IEEE Access, 9, 123208-123219. https://doi.org/10.1109/ACCESS.2021.3110408
Chen, Z., & Ren, X. (2023). An efficient boosting-based windows malware family classification system using multi-features fusion. Applied Sciences, 13(6), 4060. https://doi.org/10.3390/app13064060
Choudhary, S., & Sharma, A. (2020, February). Malware detection & classification using machine learning. 2020 International Conference on Emerging Trends in Communication, Control and Computing (ICONC3), Lakshmangarh, India, 1-4. https://doi.org/10.1109/ICONC345789.2020.9117547
Dhamija, H., & Dhamija, A. K. (2021). Malware detection using machine learning classification algorithms. International Journal of Computational Intelligence Research (IJCIR), 17(1), 1-7. https://www.ripublication.com/ijcir21/ijcirv17n1_01.pdf
Duo, W., Zhou, M., & Abusorrah, A. (2022). A survey of cyber attacks on cyber physical systems: Recent advances and challenges. IEEE/CAA Journal of Automatica Sinica, 9(5), 784-800. https://doi.org/10.1109/JAS.2022.105548
Feng, P., Ma, J., Sun, C., Xu, X., & Ma, Y. (2018). A novel dynamic android malware detection system with ensemble learning. IEEE Access, 6, 30996-31011. https://doi.org/10.1109/ACCESS.2018.2844349
Fortinet. (2022, February 8). América Latina sufrió más de 289 mil millones de intentos de ciberataques en 2021 [Press release]. https://www.fortinet.com/lat/corporate/about-us/newsroom/press-releases/2022/fortiguard-labs-reporte-ciberataques-america-latina-2021
Gao, Y., Hasegawa, H., Yamaguchi, Y., & Shimada, H. (2022). Malware detection using LightGBM with a custom logistic loss function. IEEE Access, 10, 47792-47804. https://doi.org/10.1109/ACCESS.2022.3171912
Ke, G., Meng, Q., Finley, T., Wang, T., Chen, W., Ma, W., Ye, Q., & Liu, T. Y. (2017). LightGBM: A highly efficient gradient boosting decision tree. 31st Conference on Neural Information Processing Systems (NIPS 2017), Long Beach, CA, USA. https://proceedings.neurips.cc/paper_files/paper/2017/file/6449f44a102fde848669bdd9eb6b76fa-Paper.pdf
Kim, S., Hong, S., Oh, J., & Lee, H. (2018, June). Obfuscated VBA macro detection using machine learning. 2018 48th Annual IEEE/IFIP International Conference on Dependable Systems and Networks (DSN), Luxembourg, Luxembourg, 490-501. https://doi.org/10.1109/DSN.2018.00057
Kshirsagar, D., & Agrawal, P. (2022). A study of feature selection methods for android malware detection. Journal of Information and Optimization Sciences, 43(8), 2111-2120. https://doi.org/10.1080/02522667.2022.2133218
Kumar, R., & Geetha, S. (2020). Malware classification using XGboost-Gradient boosted decision tree. Advances in Science, Technology and Engineering Systems Journal, 5(5), 536–549. https://doi.org/10.25046/aj050566
Mahdavifar, S., Kadir, A. F. A., Fatemi, R., Alhadidi, D., & Ghorbani, A. A. (2020). Dynamic android malware category classification using semi-supervised deep learning. 2020 IEEE Intl Conf on Dependable, Autonomic and Secure Computing, Intl Conf on Pervasive Intelligence and Computing, Intl Conf on Cloud and Big Data Computing, Intl Conf on Cyber Science and Technology Congress (DASC/PiCom/CBDCom/CyberSciTech), Calgary, AB, Canada, 515-522. https://doi.org/10.1109/DASC-PICom-CBDCom-CyberSciTech49142.2020.00094
Mahindru, A., & Sangal, A. L. (2021). MLDroid—Framework for Android malware detection using machine learning techniques. Neural Computing and Applications, 33, 5183-5240. https://doi.org/10.1007/s00521-020-05309-4
Liu, K., Xu, S., Xu, G., Zhang, M., Sun, D., & Liu, H. (2020). A review of android malware detection approaches based on machine learning. IEEE Access, 8, 124579-124607. https://doi.org/10.1109/ACCESS.2020.3006143
Louk, M. H. L., & Tama, B. A. (2022). Tree-based classifier ensembles for PE malware analysis: A performance revisit. e, 15 (9), 332. https://doi.org/10.3390/a15090332
Onoja, M., Jegede, A., Blamah, N., Abimbola, O. V., & Omotehinwa, T. O. (2022). EEMDS: Efficient and effective malware detection system with hybrid model based on xceptioncnn and lightgbm algorithm. Journal of Computing and Social Informatics, 1(2), 42-57. https://doi.org/10.33736/jcsi.4739.2022
Palša, J., Ádám, N., Hurtuk, J., Chovancová, E., Madoš, B., Chovanec, M., & Kocan, S. (2022). MLMD—A malware-detecting antivirus tool based on the XGBoost machine learning algorithm. Applied Sciences, 12(13), 6672. https://doi.org/10.3390/app12136672
Şahın, D. Ö., Akleylek, S., & Kiliç, E. (2022). LinRegDroid: Detection of Android malware using multiple linear regression models-based classifiers. IEEE Access, 10, 14246–14259. https://doi.org/10.1109/ACCESS.2022.3146363
Sönmez, Y., Salman, M., & Dener, M. (2021). Performance analysis of machine learning algorithms for malware detection by using CICMalDroid2020 dataset. Düzce University Journal of Science and Technology, 9(6), 280-288. https://doi.org/10.29130/dubited.1018223
Surendran, R., & Thomas, T. (2022). Detection of malware applications from centrality measures of syscall graph. Concurrency and Computation: Practice and Experience, 34(10). https://doi.org/10.1002/cpe.6835
Surendran, R., Thomas, T., & Emmanuel, S. (2020). On existence of common malicious system call codes in android malware families. IEEE Transactions on Reliability, 70(1), 248-260. https://doi.org/10.1109/TR.2020.2982537
Urooj, B., Shah, M. A., Maple, C., Abbasi, M. K., & Riasat, S. (2022). Malware detection: a framework for reverse engineered android applications through machine learning algorithms. IEEE Access, 10, 89031-89050. https://doi.org/10.1109/ACCESS.2022.3149053
Wu, B., Chen, S., Gao, C., Fan, L., Liu, Y., Wen, W., & Lyu, M. R. (2021). Why an android app is classified as malware: Toward malware classification interpretation. ACM Transactions on Software Engineering and Methodology (TOSEM), 30(2), 1-29. https://doi.org/10.1145/3423096