Determining the Scale of The Most Prominent
Asset Management Firms Using Data Analytics
Erick Leonel García Ibáñez
https://orcid.org/0000-0001-8952-9143
Peter the Great St. Petersburg Polytechnic University
St. Petersburg, Russia
Received: April 30th, 2024 / Accepted: June 1st, 2024
doi: https://doi.org/10.26439/interfases2024.n19.7072
ABSTRACT. Peter Phillips and other prominent authors shed light on the existence of hidden superpowers that exert influence over the world’s most important corporations. This power also extends to major global communications entities. Phillips highlights that 17 of the so-called ‘Giants’ manage portfolios with a staggering $1 trillion or more in assets. Additionally, there is a small group of institutions called the ‘Big Three,’ globally recognized asset management giants comprising BlackRock, Vanguard Group, and State Street Corporation. The discourse surrounding these ‘Giants’ and the ‘Big Three’ prompted the application of data analytics techniques to scrutinize and validate these assertions. Data, drawn from diverse sources such as Yahoo Finance and StockAnalysis.com, underwent meticulous cleaning to mitigate errors and address missing information. Subsequently, three hypotheses were subjected to rigorous evaluation through hypothesis testing. As a result of this process, only one of the three hypotheses proposed was rejected, leading us to conclude that the ‘Big Three’ indeed hold a very strong position among companies that belong to the most important indices (S&P 500, NASDAQ 100, DJIA) of the American financial markets.
KEYWORDS: hypothesis testing / asset management firms / the Big Three
Determinación de la escala de las firmas de gestión de activos
más prominentes mediante el análisis de datos
RESUMEN. Peter Phillips y otros autores destacados iluminan la existencia de superpotencias ocultas que ejercen influencia sobre las corporaciones más importantes del mundo, este poder también abarca a importantes entidades de comunicaciones a nivel global. Phillips resalta que 17 de los llamados ‘Gigantes’ gestionan portafolios de inversión con al menos $1 trillón en activos. De la misma manera, existe un grupo pequeño de gestores de activos denominado los ‘Tres Grandes’ (‘Big Three’), gigantes reconocidos a nivel mundial en la gestión de activos que incluyen a BlackRock, Vanguard Group y State Street Corporation. El discurso en torno a estos ‘Gigantes’ y los ‘Tres Grandes’ motivó la aplicación de técnicas de análisis de datos para examinar y validar las afirmaciones realizadas sobre ellos. Los datos, recopilados de diversas fuentes como Yahoo Finance y StockAnalysis.com, fueron sometidos a una limpieza meticulosa para mitigar errores y abordar la falta de información. Posteriormente, tres hipótesis fueron sometidas a una evaluación rigurosa mediante pruebas de hipótesis (hypothesis testing). Como resultado de este proceso, solo una de las tres hipótesis planteadas fue rechazada, lo cual nos llega a concluir que los ’Tres Grandes’ efectivamente poseen una posición muy fuerte en las empresas que pertenecen a los índices más importantes (S&P 500, NASDAQ 100, DJIA) de los mercados financieros norteamericanos.
PALABRAS CLAVE: prueba de hipótesis / firmas de gestión de activos / los Tres Grandes
1. INTRODUCTION
The arrival of globalization meant that certain brands became famous worldwide, some of which include Starbucks, Google, Facebook or Coca Cola. However, there are other big, and perhaps unknown, companies who possess a disproportionate stake in these popular brands. Peter Phillips (2018) identifies the top 17 asset management firms, which he calls “Giants”. These firms hold very strong positions among companies that belong to the most important indices (S&P 500, NASDAQ 100, DJIA) of the American financial markets. Accordingly, a consensus among various authors such as Lund and Robertson (2023) and McLauglin and Massa (2020) reinforce the acknowledgment of the widely recognized concept known as the ‘Big Three’. These mega companies are BlackRock, Vanguard Group and State Street Corporation.
Both the Giants and Big Three are entities that maintain extensive holdings in numerous companies across various industries and countries. One might wonder if they truly are of such immense scale or whether it beneficial for a handful of companies to wield such substantial power and influence worldwide. However, this article does not delve into ethical considerations; rather, its primary focus is to assess the global relevance and influence of the Big Three in international business. This relevance will be measured by confirming or rejecting various hypotheses derived from statements made by Phillips (2018), Lund and Robertson (2023) and McLauglin and Massa (2020), utilizing data analytics techniques. Data will be collected from different sources, cleaned, transformed and analyzed. In the following section, the basics of investments and data analytics will be explained.
Basic concepts in asset management
According to Smart et al. (2017), a common stock offers income and capital gains. An example of income gain are dividend distributions from the company’s profits, whereas a capital gain refers to the stock’s increase in price. Common stocks cannot be bought directly from the issuer, but have to be traded through a centralized entity that connects buyers and sellers, called stock exchange. Furthermore, an asset can be understood as anything that delivers value to the organization or stakeholders (Canadian Network of Asset Managers, 2018). An investment is the action of acquiring an asset with the main purpose of generating profit. Organizations whose goal is to execute investing activities and manage investment portfolios are usually called asset management firms. The Canadian Network of Asset Managers (2018) describes asset management as an integrated process with the aim of effectively managing assets in order to deliver services to customers.
Collin (2023) identifies the steps of the asset management process. The first step consists on setting the goals and market assumptions for the portfolio. The strategy for asset allocation will then be developed along with capital deployment. The company should pick the financial assets in which the funds shall be invested: stocks, mutual funds, exchange traded funds (ETF) and others. Smart et al. (2017) assert that both mutual funds and ETFs,are similar in that they allow the creation of well-diversified portfolios by holding a variety of securities. Nonetheless, ETFs can be bought or sold at current market price in regular stock exchanges. while mutual funds are traded through the fund itself or through a financial intermediary (Smart et al., 2017; U.S. Securities and Exchange Commission, 2021)
Basic concepts in data analytics
The relevance of data and data strategies for the organization is undeniable. Kambatla et al. (2014) refer to data as a resource, while Arora and Goyal (2016) point out that data is the biggest asset inside an organization. But data itself is not enough: it must be analyzed to derive value from it. This is where data analytics comes into place as a set of techniques that focus on gaining actionable insight for smart decision-making (Duan & Da Xu, 2021).
Arora and Goyal (2016) refer to four types of data according to its source or precedence, while other authors such as Kambatla et al. (2014), Vashisht and Gupta (2015) and Vanani and Majidian (2019) identify 3 categories and Stevens (2023) establishes only 2 categories. In this research, the 3-category classification is suggested: structured (e.g. Excel files, relational databases), semi-structured (e.g. text, emails) and unstructured (e.g. videos, audios).
The classification of data analytics methods is also a matter of debate. Duan and Da Xu (2021) describe 3 categories and Kelley (2020) details 6 categories, but the most popular is one with 4 categories described in Oracle (s/f), Stevens (2023) and Mathur (2023). Tom March (2020) describes the 4 main types of data analytics as follows:
- Descriptive Analysis: Valuable for recognizing past events.
- Diagnostic Analysis: Convenient for explaining the reasons behind occurrences.
- Predictive Analysis: Utilized to forecast future trends based on historical data.
- Prescriptive Analysis: Capable of predicting probable outcomes and offering decision recommendations.
Section 2 provides an in-depth examination of the techniques and methods available and explains the process utilized to prove or disprove the hypotheses. In Section 3, the project outcomes are elucidated. Section 4 offers a concise discussion on the hypothesis and collected data. Ultimately, Section 5 encapsulates the research’s conclusions.
2. MATERIALS AND METHODS
Instruments
In data analytics, various approaches exist concerning the processes, methods and techniques employed. This section undertakes a comparative analysis of these approaches. Notably, researchers such as Kelley (2020), Stevens (2023) and Peck et al. (2008) present different perspectives on the phases involved in data analytics projects, ranging from 5 to 6 phases, which is laid out in Table 2.
Table 1
Phases in a data analytics project
|
Phase |
Kelley (2020) |
Stevens (2023) |
Peck et al. (2008) |
|
#1 |
- Data Requirement Gathering |
- Defining the question |
- Understanding the nature of the problem |
|
#2 |
- Data Collection |
- Data Collection |
- Deciding what to measure and how to measure it. |
|
#3 |
- Data Cleaning |
- Data Cleaning |
- Data Collection |
|
#4 |
- Data Analysis |
- Data Analysis |
- Data summarization and preliminary analysis |
|
#5 |
- Data Interpretation |
- Data Visualization and sharing findings |
- Formal data analysis |
|
#6 |
- Data Visualization |
- Interpretation of results |
Numerous criteria exist for classifying data analytics methods and techniques (Duan & Da Xu, 2021; Kelley, 2020; Stevens, 2023; Taherdoost, 2022; Vashisht & Gupta, 2015). Some of them are highlighted in Table 2. One prevalent classification method involves categorizing methods into two broad groups: qualitative and quantitative. As elucidated by Kelley (2020), qualitative analysis concentrates on handling unstructured data, while quantitative analysis involves the collection and processing of raw data into numerical formats.
Table 2
Classification of data analytics methods
|
Qualitative Analysis |
Quantitative Analysis |
||||
|
Descriptive |
Inferential |
Exploratory |
Predictive |
Prescriptive |
|
|
- Content analysis |
- Mean |
- Regression analysis |
- Cluster analysis |
- Support vector machines |
- Genetic algorithm |
|
- Sentiment analysis |
- Median |
- Time series analysis |
- Factor analysis |
- Neural networks |
|
|
Qualitative Analysis |
Quantitative Analysis |
||||
|
Descriptive |
Inferential |
Exploratory |
Predictive |
Prescriptive |
|
|
- Narrative analysis |
- Mode |
- Hypothesis testing |
- Decision tree |
||
|
- Grounded theory |
- Standard deviation |
- ANOVA |
|||
|
- Skewness |
|||||
Methodology design
We employed inferential analysis and hypothesis testing to validate certain statements outlined by Phillips (2018), Lund and Robertson (2023) and McLauglin and Massa (2020). The project unfolded in five phases, following the approach detailed by Stevens (2023). In hypothesis testing, a hypothesis is a proposition regarding the value of one or more population characteristics (Peck et al., 2008). The null hypothesis (H0), often the initial assumption, is the claim presumed to be true. Conversely, the alternative hypothesis (Ha), which represents an alternative scenario, stands as the second option. The outcome of the process may lead to either rejecting the null hypothesis or failing to reject it, signifying that the alternative hypothesis is deemed correct.
In Figure 1 you can see some of the most important elements in hypothesis testing. First, confidence level refers to the probability that the null hypothesis will be accepted. Conversely, significance level ( ) is in the rejection area of the null hypothesis. Both confidence and significance level add up to 100% (or 1). P-value is referred to as the probability of rejecting the null hypothesis. If the p-value is lower than
  , the null hypothesis is rejected. Otherwise, the test fails to reject null hypothesis.
The example in Figure 3 shows a two-tailed test as it has two rejection areas on both sides. A one-tailed test has only one rejection area, on the right or left.
Figure 1
Elements in hypothesis testing

Figure 2 illustrates the stages of the data analytics project. Next, we will elaborate on each step:
Figure 2
Phases in data analytics project
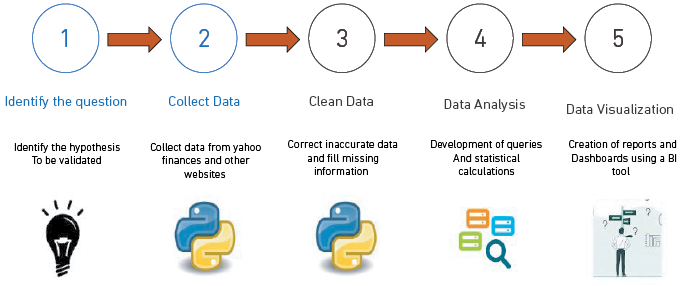
Identify the question
In his book Giants, Peter Phillips (2018) states his intention to direct our concern towards powerful networks that affect our lives and society, making the following statements regarding this powerful grid:
- 17 of the most prominent asset management firms possess over $1 trillion in assets as of 2017, as seen in Table 3.
- These top firms also tend to hold positions in each other, creating a solid network with shared investments worldwide.
- There are a total of 199 people in the boards of directors of the top 17 asset management firms, who control and manage an accumulation of $41.1 trillion in assets.
While they do not agree on the exact numbers, Lund and Robertson (2023) and McLauglin and Massa (2020) acknowledge BlackRock as the largest global asset manager draw the following deductions about the Big Three:
- They represent the largest owners of most companies included in the S&P 500, owning at least 22 % in 2019.
- Collectively, they hold an average 25 % of the votes in companies included in S&P 500.
- They have the power to influence the outcome of shareholder proposals at companies included in the Fortune 250.
- The Big Three are closely and exclusively related to passive investment.
Phillips (2018), Lund and Robertson (2023) and McLauglin and Massa (2020) expounded on a set of statements regarding some of the largest asset management firms globally. The first and second statements center around the Big Three mentioned in Lund and Robertson (2023) and McLauglin and Massa (2020), bringing up some important facts about their relevance and investing strategy. The last statement pertains to the top 5 US asset management firms selected from the list of 17 companies outlined by Phillips (2018), which includes BlackRock, Vanguard Group, JP Morgan Chase, Bank of America, and State Street. Table 3 contains the 3 tested hypotheses.
Table 3
Main statements made by Phillips (2018), Lund and Robertson (2023) and McLauglin and Massa (2020)
|
Order |
Statement |
Null |
Alternative |
|
#1 |
The Big Three own 22 % of companies included in the S&P 500, each one owning 7.33 %. |
p = 7.33 % |
p <> 7.33 % |
|
#2 |
The “Big Three” are closely and exclusively related to passive investment (at least 90 % of the portfolio). |
p ≥ 90 % |
p < 90 % |
|
#3 |
Global media are controlled by the “Global Power Elite”. The Big Three own at least 15.56 % of the largest global media corporations. |
p ≥ 15.56 % |
p < 15.56 % |
Collect Data
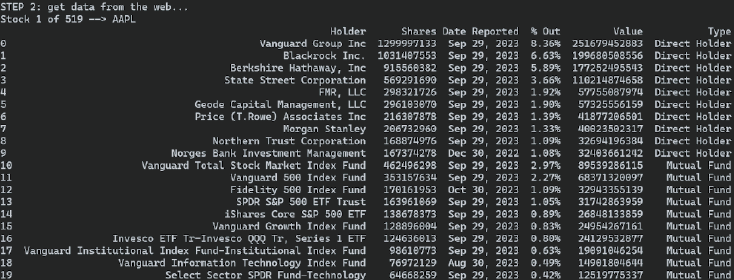
Data collection was performed using web scraping in the Python programming language. Collected data includes: company data (e.g. country, sector) from the Stock Analysis (2023a) website, top 10 mutual fund holders from the Yahoo Finance website, and the list of companies that compound the most important indices in the American exchanges: Standard & Poor 500 (Stock Analysis, 2023b), NASDAQ 100 (Stock Analysis, 2023c), Dow Jones Industrial Average (DJIA) (Stock Analysis, 2023d).
Neufeld (2023) singled out the leading 25 global stock exchanges, which boast a cumulative market capitalization of around $107 trillion. Most notably, the New York Stock Exchange (NYSE) at $25 trillion and NASDAQ at $21.7 trillion collectively command nearly 44 % of this market value, for which the sample will include companies listed in both exchanges. As part of the analysis process, for each company under examination we systematically gathered data on the top 10 individual shareholders with direct investments in the organization, along with the top 10 mutual funds holding shares in the company through passive investment. Data was collected on March 5th, 2024.
Figure 3 shows an example of the data collection process, where top 10 holders (direct holders and mutual funds) of Apple (AAPL) are being web scrapped. Data was collected on January 28th, 2024.
Figure 3
Data collection process
Clean Data
Python programming language was also utilized for the data cleaning process. This phase consisted of validating data and handling missing values. Some of the tasks executed during the phase included performing data exploration, converting text into proper numeric format, dismissung duplicate data related to the total list of companies included in the analysis and standardizing the names of the mutual funds to more easily identify the holder.
Data Analysis
First, we used hypothesis testing to prove or disprove the thesis that each of the Big Three, as stated in Lund and Robertson (2023) and McLauglin and Massa (2020), own an average of 7.33 % (22 % in total) of the companies included in the S&P 500. Since we are working with proportions and our sample is very limited, t-test was used. Hypothesis was tested with a confidence level of 95 % and alpha value of 0.05. The hypotheses are:
Null hypothesis (H0): p = 7.33%.
Alternative hypothesis (Ha): p <> 7.33%
The second statement under scrutiny points out that the Big Three are closely and exclusively associated with passive investment. Because authors Lund and Robertson (2023) and McLauglin and Massa (2020) do not provide an exact quantification of how much of the portfolio is deemed to consist ‘close or exclusively’ of passive investment, an assumed figure of 90 % is adopted for analysis purposes. Passive investment, by definition, entails an investment strategy crafted to minimize risk and streamline portfolio selection by favoring assets like mutual funds and ETFs. Additionally, the t-test was employed for further evaluation, with a confidence level of 95 % and significance level equal to 0.05. The hypotheses are:
Null hypothesis (H0): p ≥ 90 %
Alternative hypothesis (Ha): p < 90 %
Peter Phillips (2018) states that global media are owned and controlled by the Global Power Elite. Table 4 contains 5 of the companies identified by Phillips (2018), of which two are not listed in any exchange (Time Warner and Viacom/CBS). Next, we calculated what share of the media firms is owned by the Big Three in terms of money and percentage. It is important to highlight that 21st Century Fox is now called Fox Corporation, and Time Warner is now called Warner Bros Discovery. According to the table in Table 4, the Big Three possess an average 15.56 % of the world’s largest media as of 2017: 18.16 % of Comcast Corp., 17.81 % of Disney, and 10.72 % of 21st Century Fox.
Table 4
Top transnational news and entertainment corporations (Phillips, 2018)
|
Asset Management Firm |
Money invested Media Company (Billion USD) |
||||
|
Comcast Corp. |
Disney |
Time Warner |
Viacom and CBS |
21st Century Fox |
|
|
BlackRock |
14.400 |
9.300 |
4.000 |
1.280 |
0.852 |
|
Vanguard Group |
12.300 |
10.700 |
4.500 |
1.390 |
0.997 |
|
State Street |
7.300 |
7.100 |
2.700 |
0.861 |
0.588 |
|
Bank of America |
2.300 |
1.800 |
0.517 |
0.154 |
0.064 |
|
e |
2.160 |
2.500 |
0.707 |
0.252 |
0.135 |
|
JPMorgan Chase |
2.100 |
1.800 |
0.636 |
0.476 |
0.162 |
|
Capital Group |
2.100 |
-- |
0.907 |
1.740 |
0.000 |
|
UBS |
1.400 |
0.927 |
0.395 |
0.168 |
0.083 |
|
Goldman Sachs Group |
1.190 |
0.921 |
0.908 |
0.109 |
0.207 |
|
Prudential Financial |
0.737 |
0.310 |
0.000 |
0.068 |
0.070 |
|
Morgan Stanley |
0.663 |
2.700 |
0.624 |
0.215 |
0.569 |
|
Total owned by firms |
46.65 |
38.06 |
15.89 |
6.71 |
3.73 |
|
Owned by ‘Big Three’ |
34.00 |
27.10 |
11.20 |
3.53 |
2.44187.19 |
|
Market Cap in 2017 |
187.19 |
152.14 |
(Not listed) |
(Not listed) |
22.74 |
|
% Owned by ‘Big Three’ |
18.16 % |
17.81 % |
(Not listed) |
(Not listed) |
10.72 % |
|
% Average Owned by ‘Big Three’ |
15.56 % |
||||
Dellatto (2023) wrote an article listing world’s largest media companies as of 2023. The task at hand is to verify the notion that the Big Three still own at least 15.56 % of the largest global media corporations in 2023 using t-test. The sample will include the following publicly traded media companies: Comcast Corp. (NASDAQ: CMCSA), Fox Corp. (NASDAQ: FOX), Disney (NYSE: DIS), Omnicom Group (NYSE: OMC), Charter Communications (NASDAQ: CHTR), and Warner Bros Discovery (NASDAQ: WBD). These are the hypotheses:
Null hypothesis (H0): p ≥ 15.56 %
Alternative hypothesis (Ha): p < 15.56 %
Data Visualization: Power BI
Once data has been properly collected, formatted and analyzed it is time to share the results. There are many data visualization tools in the market today (Tripathi & Bagga, 2020; Srivastava et al., 2022) that can be evaluated and selected according to the user’s needs. Some of the most popular are Power BI, Zoho Analytics, Tableau, Locker and Qlik. Power BI was the selected BI tool as it is supported by most platforms. In addition, Power BI works in the cloud and on-promise (Tripathi & Bagga, 2020).
3. RESULTS
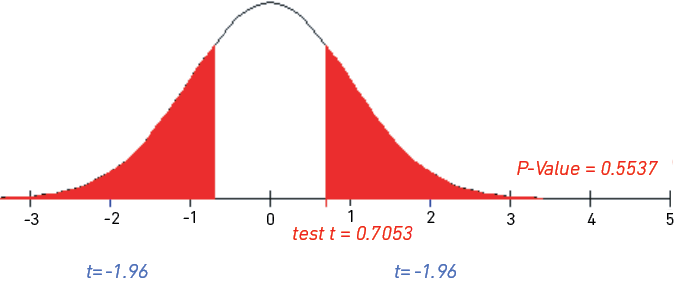
The first hypothesis states that the “Big Three” hold an average of 7.33 % (22 % in total) of all the companies included in the S&P 500 index. As shown in Figure 4, for a confidence level of 95 % and alpha equal to 0.025 for a two-tailed test, the calculated p-value is 0.5537. Since the p-value is higher than α, we fail to reject the null hypothesis (H0): p = 7.33 %.
Figure 4
Illustration of the results of hypothesis testing related to ownership in companies in S&P 500
using t-test
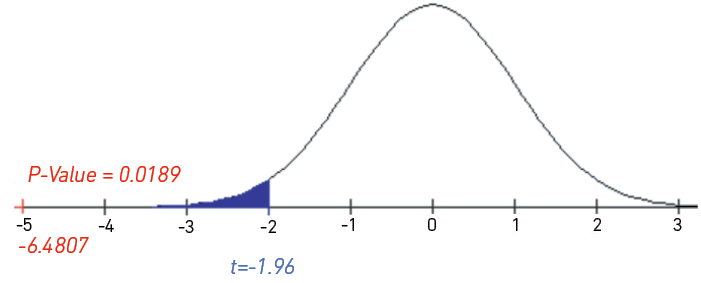
In regards to the second hypothesis about the Big Three’s association with passive investment, the test results are delineated below. As illustrated in Figure 7, the proportion of the portfolio allocated to mutual funds or ETFs was computed under the assumption that it constitutes a minimum of 90 % (≥90 %) of the entire portfolio. Employing a 95% confidence level for this test, corresponding to a significance value of 0.05 for a left-tailed test, the calculated p-value is 0.0189 as shown inc Figure 5. Since the p-value is lower than  , we reject the null hypothesis (H0): p ≥ 90 %.
Figure 5
Illustration of the results of hypothesis testing related to passive asset management using t-test
The third hypothesis refers to the control of the largest media corporations by certain “Giants” in the asset management sector, confirming that the “Big Three” own at least 15.56 % of big media companies. After considering a confidence level of 95 % and a significance level of 0.05 for a left-tailed test, the p-value is 0.9979 (see Figure 6). Since the p-value is not lower than  , we fail to reject the null hypothesis (H0): p ≥ 15.56 %.
Figure 6
Illustration of the results of hypothesis testing related to ownership in big media companies using t-test

4. DISCUSSION
In the previous chapter three hypotheses were tested using statistical techniques. Here, some charts will be employed to strengthen our results.
McLauglin and Massa (2020) stated that 22 % of the shares in the S&P 500 were held by the Big Three, up from 13 % in 2008. Figure 7 shows the share of the companies in the most important indexes in US exchanges that they own: 28.31 % in S&P 500, 24.54 % in NASDAQ 100, and 28.24 % in DJIA.
Figure 7
Value of ownership of the Big Three in US indices
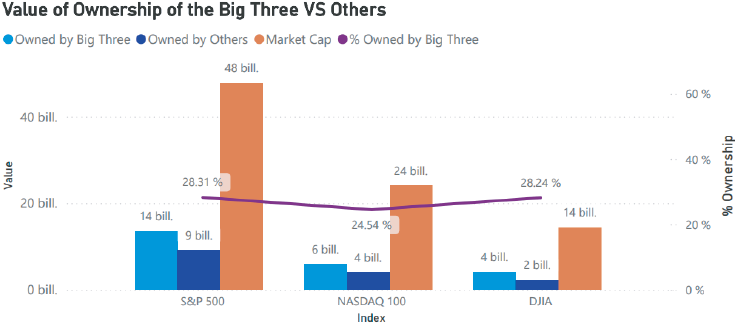
Figure 8. Illustration of the results of hypothesis testing related to the ownership in big media companies using t-test.
Furthermore, individually the Big Three are each among the Top 5 holders in the S&P 500, which are listed in Figure 8. Vanguard Group Inc is the largest investor with $7.3 trillion, followed by BlackRock with $3.7 trillion and State Street Corporation with $2.6 trillion.
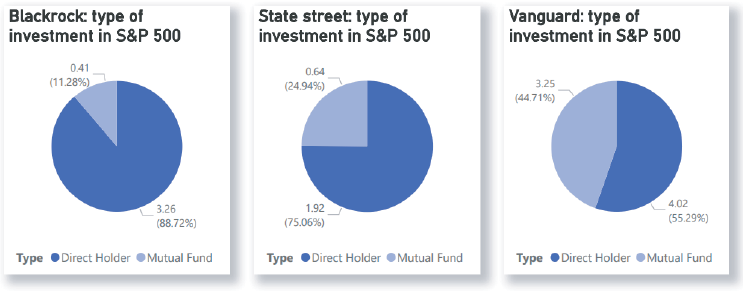
Lund and Robertson (2023) refer to the Big Three as passive investors. Figure 9 illustrates the type of investment that each of the Big Three has in the S&P 500 companies. Direct Holder refers to a company investing in a particular asset as an active investor, whereas Mutual Funds is related to a passive investment strategy. Contrary to the author’s statement, data shows that the largest assets managers in the world prefer active investing over passive investing. The asset manager with the highest proportion of its portfolio invested using active investment is BlackRock with 88.72 %, followed by State Street Corporation with 75.06 % and lastly Vanguard Group Inc with 55.29 %. Based on the data, Lund and Robertson’s statement on big asset managers and passive investment lacks support.
Figure 8
Top 5 holders in S&P 500
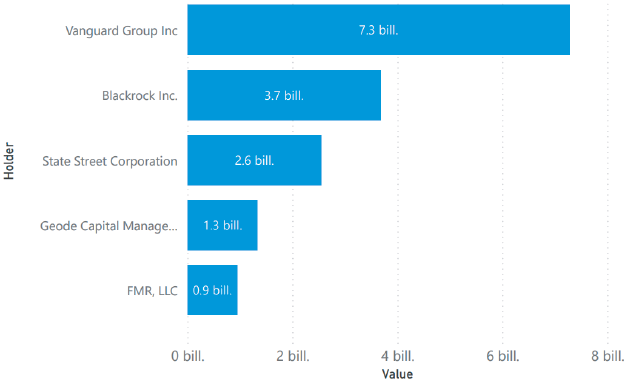
Figure 9
Type of investment developed by the Big Three in S&P 500 companies
Phillips’s (2018) research pointed out that the global power elite controls global corporate media, such as Comcast Corp. or Disney. Figure 10 lists the biggest media corporations and calculates how much of them is owned by the Big Three. It is clear that the Big Three hold important positions in companies like Comcast Corp. (CMCSA: 29.12 %), Disney (DIS: 28.73 %), Warner Bros Discovery (WBD: 31.65 %), and Omnicom Group Inc. (OMC: 40.87 %).
Figure 10
Ownership of the Big Three on Big Media companies
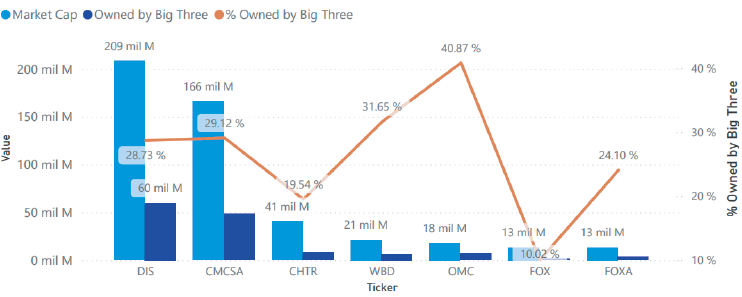
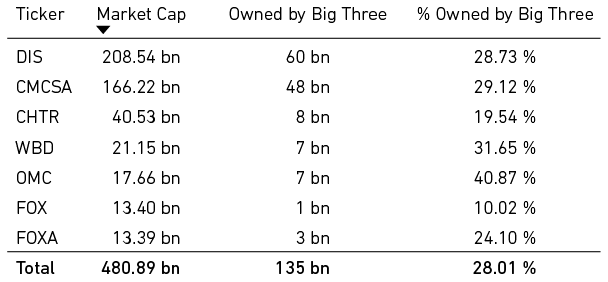
Table 6 not only shows individual investment in big media corporations, but also the total value invested by the Big Three as a whole. The Top 3 asset managers possess 28.73 % of all big media firms, worth $135 billion.
Table 6
Total ownership of the Big Three in big media companies
5. CONCLUSION
This article delves into insights provided by key sources such as Phillips (2018), Lund and Robertson (2023) and McLauglin and Massa (2020) regarding the most prominent asset managers, often referred to as ‘Giants’ or the ‘Big Three’. Distilling information from these references, three hypotheses were formulated and scrutinized through hypothesis testing, as detailed in Table 3. The results of the data analytics process unfold as follows: Hypothesis #1, positing that the Big Three collectively own an average of 7.33 % of companies within the S&P 500, was supported. Conversely, the hypothesis #2 suggesting that the Big Three control over 90 % of the portfolio in passive investment was rejected. Meanwhile, the hypothesis #3 asserting that the ‘Global Power Elite’ commands approximately 15.56 % of the largest media corporations did not face rejection.
As of March 2024, the Big Three command formidable influence, holding 28.31 % of the total market value of S&P 500, 24.54 % of NASDAQ 100, and 28.24 % of DJIA. This substantial ownership underscores the undeniable level of power and influence they wield to advance their interests.
REFERENCES
Arora, Y., & Goyal, D. (2016). Big data: a review of analytics methods & techniques. 2016 2nd International Conference on Contemporary Computing and Informatics (IC3I), pp. 225-230. doi: 10.1109/IC3I.2016.7917965.
Canadian Network of Asset Managers. (2018). Asset Management 101. The what, why, and how for your community. https://www.assetmanagementbc.ca/wp-content/uploads/Asset-Management-101-The-What-Why-and-How-for-Your-Community-CNAM.pdf
Collin, V. (2023, September 4). What is asset management. Financial Edge. https://www.fe.training/free-resources/asset-management/what-is-asset-management/
Dellatto, M. (2023, June 8). The world’s largest media companies in 2023: Comcast and Disney stay on top. Forbes. https://www.forbes.com/sites/marisadellatto/2023/06/08/the-worlds-largest-media-companies-in-2023-comcast-and-disney-stay-on-top/?sh=1b990b4654c6/
Duan, L., & Da Xu, L. (2021). Data analytics in industry 4.0: a survey. Information Systems Frontiers: A Journal of Research and Innovation. https://doi.org/10.1007/s10796-021-10190-0
Kambatla, K., Kollias, G., Kumar, V., & Grama, A. (2014). Trends in big data analytics. Journal of Parallel and Distributed Computing, 74(7), 2561–2573. https://doi.org/10.1016/j.jpdc.2014.01.003
Kelley, K. (2020, 27 de mayo). What is data analysis? Pprocess, types, methods and techniques. Simplilearn. https://www.simplilearn.com.cach3.com/data-analysis-methods-process-types-article.html
Lund, D. S., & Robertson, A. (2023). Giant asset managers, the big three, and index investing. USC CLASS Research Paper (23-13). https://doi.org/10.2139/ssrn.4406204
March, T. (2020, January 10). 4 types of data analytics for educators. Tom March.com. https://tommarch.com/2020/01/4-types-data-analytics-for-educators/
Mathur, G. (2023, September 19). Data science vs data analytics: unpacking the differences. IBM Blog. https://www.ibm.com/blog/data-science-vs-data-analytics-unpacking-the-differences/
McLauglin, D., & Massa, A. (2020). The hidden dangers of the great index fund takeover. Bloomberg. https://www.bloomberg.com/news/features/2020-01-09/the-hidden-dangers-of-the-great-index-fund-takeover
Neufeld, D. (2023, October 18). Mapped: the largest stock exchanges in the world. Advisor Channel. https://advisor.visualcapitalist.com/largest-stock-exchanges-in-the-world/
Oracle. (s/f). What is data analytics? Oracle.com. https://www.oracle.com/business-analytics/data-analytics/
Peck, R., Olsen, C., & DeVore, J. L. (2008). Introduction to statistics and data analysis (3a ed.). Wadsworth Publishing.
Phillips, P. (2018). Giants: the global power elite. Seven Stories Press.
Vanani, I. R., & Majidian, S. (2019). Literature review on big data analytics methods. In: A. Cano (Ed). Social Media and Machine Learning. IntechOpen. https://doi.org.10.5772/intechopen.86843
Smart, S. B., Gitman, L. J., & Joehnk, M. D. (2017). Fundamentals of investing (13a ed.). Pearson.
Srivastava, G., Muneeswari, S.,Venkataraman, R., Kavitha, V. & Parthiban, N. (2022). A review of the state of the art in business intelligence software. Enterprise Information Systems, 16(1), 1–28. https://doi.org/10.1080/17517575.2021.1872107
Stevens, E. (2023, May 10). The 7 most useful data analysis methods and techniques. CareerFoundry. https://careerfoundry.com/en/blog/data-analytics/data-analysis-techniques/
Stock Analysis (2023a). Free online stock information for investors. Stock Analysis. Recuperado el 20 de mayo de 2024. https://stockanalysis.com/
Stock Analysis (2023b). S&P 500 index stocks list. https://stockanalysis.com/list/sp-500-stocks/
Stock Analysis (2023c). NASDAQ 100 index stocks list. https://stockanalysis.com/list/nasdaq-100-stocks/
Stock Analysis (2023d). Dow Jones Industrial Average Stocks List. https://stockanalysis.com/list/dow-jones-stocks/
Taherdoost, H. (2022). Different types of data analysis; data analysis methods and techniques in research projects. International Journal of Academic Research in Management, 9(1),1-9. https://ssrn.com/abstract=4178680
Tripathi, A., & Bagga, T. (2020). Leading business intelligence (BI) solutions and market trends. SSRN Electronic Journal. https://doi.org/10.2139/ssrn.3568414
U.S. Securities and Exchange Commission. (2021, April 2). Investor bulletin: characteristics of mutual funds and exchange-traded funds (ETFs). Investor.gov. https://www.investor.gov/introduction-investing/general-resources/news-alerts/alerts-bulletins/characteristics-mutual-funds-exchange-traded-funds/
Vashisht, P., & Gupta, V. (2015). Big data analytics techniques: a survey. 2015 International Conference on Green Computing and Internet of Things (ICGCIoT), 264–269. doi: 10.1109/ICGCIoT.2015.7380470
Yahoo Finance. (2023). Matching Mutual Funds. Recuperado el 20 de mayo de 2024, de https://finance.yahoo.com/