Recibido: 2/3/2022 / Aceptado 2/7/2022
doi: https://doi.org/10.26439/interfases2022.n015.5794
Football pitch condition analysis
based on k-means clustering
Héctor Eduardo Ugarte Rojas
[email protected] / ORCID: 0000-0002-5338-2140
Departamento Académico de Ingeniería Informática
Universidad Nacional de San Antonio Abad del Cusco, Peru
[email protected] / ORCID: 0000-0002-6844-7680
Departamento Académico de Ingeniería Informática
Universidad Nacional de San Antonio Abad del Cusco, Peru
Football, a highly popular sport all over the world, requires that professional footballers practice it on a field of play in ideal conditions, which, among other things, includes the usage and maintenance of healthy natural grass. In this study, we present an unsupervised allocator strategy for image analysis of football pitches that uses k-means clustering and color comparison to assess whether a playing field is in good or bad condition. Our approach considers proportions of dominant RGB colors for automatized decision-making. We developed a prototype and tested it with a series of images; this paper offers a comparison between the findings of this test and our expected results.
KEYWORDS: image analysis / k-means algorithm / dominant colors / clustering / football
Análisis de la condición del campo de fútbol basado en el agrupamiento de k-means
RESUMEN. El fútbol, un deporte muy popular en todo el mundo, requiere que los futbolistas profesionales lo practiquen en un campo de juego en condiciones ideales, lo que, entre otras cosas, incluye el uso y mantenimiento de un césped natural saludable. En este estudio, presentamos una estrategia de asignación sin supervisión para el análisis de imágenes de campos de fútbol que utiliza agrupamiento k-means y comparación de colores para evaluar si un campo de juego está en buenas o malas condiciones. Nuestro enfoque considera las proporciones de los colores RGB dominantes para automatizar la toma de decisiones. Para tal fin, se desarrolló un prototipo que se probó con una serie de imágenes; los resultados obtenidos se compararon con los esperados.
PALABRAS CLAVE: análisis de imágenes / algoritmo k-means / colores dominantes / clustering / fútbol
1. INTRODUCTION
The world´s most popular game is football (usually called soccer, mainly in the United States) (Szymanski, 2014). It is a team sport involving two squads of eleven players. The game’s objective is to score a ball into the opposing goal using any part of the body except the hands and the arms. Only the goalkeepers may use their hands or arms (inside a pitch area called the penalty area) to prevent the opposing team from scoring. The team scoring the greater number of goals is the match’s winner, which usually lasts 90 minutes. It is usually played on a rectangular grass field but can also be played on artificial turf.
A natural grass field is highly preferred to artificial turf for the professional practice of the sport. Artificial turfs should only be used when grass maintenance is problematic due to adverse weather (very wet, extremely dry, or frequent snow). The International Federation of Football Association (a.k.a. FIFA - Fédération Internationale de Football Association) recommends field of play dimensions fo 105 meters in length and 68 meters in width. An optimal playing surface must be flat and even with complete grass coverage; it must also be free of potholes. The playing field is marked with lines following pitch dimensions (Football NSW Limited, 2015).
Although FIFA highly recommends playing on an optimal sports ground, it is common in regions with developing countries such as Latin America to play professional football on inadequate pitches. The condition of a playing field is important not simply for aesthetic reasons: it can also affect players’ safety and the quality of play. Normally, the condition of a football ground is evident to the eye. The color of healthy grass should always be green it should be maintained by professionals and the sward sould be constantly cut short. Figure 1 shows an artificial turf that might easily be mistaken for a natural field in excellent condition.
Figure 1
A football field at Brastad arena, Brastad, Lysekil Municipality, Sweden
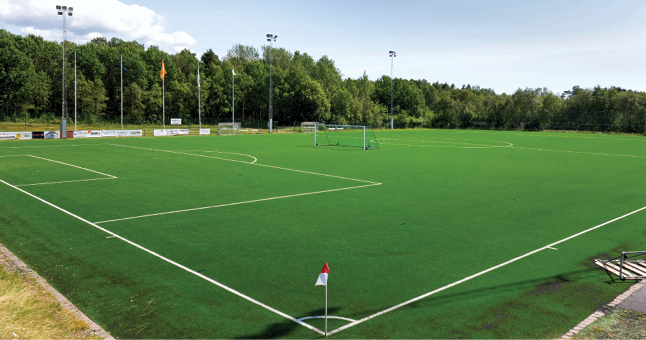
Note. Carter (2019)
Figure 2
The football field at Zelengaj, Dugave neighbourhood, Zagreb, Croatia
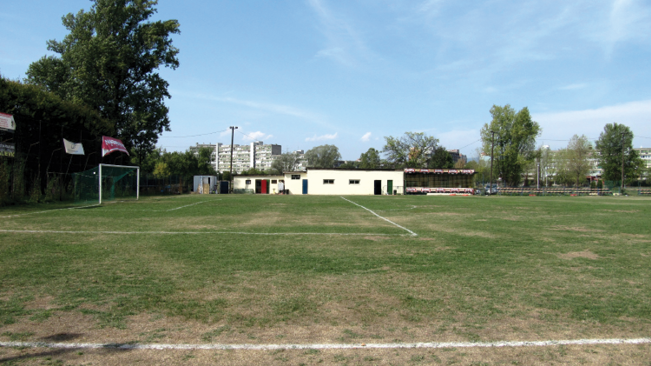
Note. Radovanović (2011)
Pitches in bad condition show brownish or yellowish colored patches of dead grass, dirt field spots, and others, as is evident in figure 2. Football fans and journalists know the importance of pitches in good condition, so it is a common practice to paint bad grass fields green. For instance, El País (2018) informed that the field of the historic Uruguayan Centenario stadium was painted for a final match after being damaged by the stage set up for a rock concert.
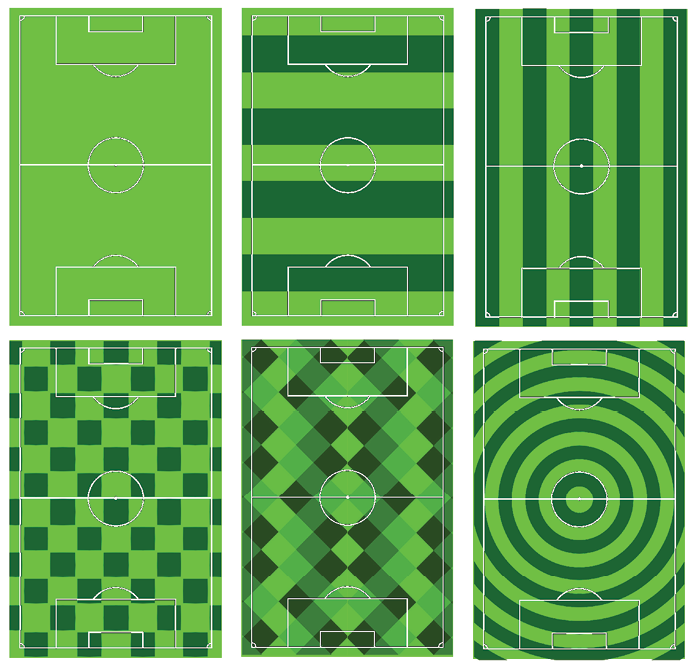
As we see, pitches in good condition are all green with white marking painted lines. Different patterns can be created depending on how the sward is cut. In figure 3, we present some popular patterns where different shades of green are present.
Figure 3
Popular football playing field grass patterns
Solomon and Breckon (2011) define image analysis as extracting useful information from images, mostly digital, using image processing techniques. It has a wide range of applications in astronomy, medicine, and robotics, to name a few. The process of splitting a digital image into multiple image segments is known as image segmentation. This technique makes the representation of an image more meaningful and easier to examine by simplifying and/or changing it (Stockman & Shapiro, 2001).
This research paper presents a technique to establish the condition of a football pitch based on RGB image analysis. K-means clustering was chosen for this analysis since it is a popular technique to obtain dominant colors used by different researchers (Pavan Kumar et al., 2020; Sharma, 2021). After comparing each dominant color with shades of green, a decision has to be made according to an analysis. For validation, a prototype has been implemented and tested with a set of pictures, where the computer analysis results obtained are compared with those of simple visual examination.
2. BACKGROUND
2.1 RGB color model
A color model is a systematic method for generating a wide range of colors from a small number of primary colors (Rhyne, 2016). Red, Green, and Blue are the main colors in the RGB additive color model. It is used in many applications such as digital images, color scanners, digital cameras, and digital screens (Loesdau et al., 2014). Each color is expressed as a triple from 0 (least intense) to 255 (most intense). Therefore, there are 16,777,216 (256 x 256 x 256) possible combinations. Some representations for popular colours are: red (255,0,0), green (0,255,0), blue (0,0,255), black (0,0,0), white (255,255,255), yellow (255,255,0), cyan (0,255,255), magenta (255,0,255).
As a result of representing each color in a 3D space, we obtain a cube where we get a wider visual spectrum of the RGB color space, as seen in figure 4. R, G, and B axes are used.
Figure 4
RGB color cube
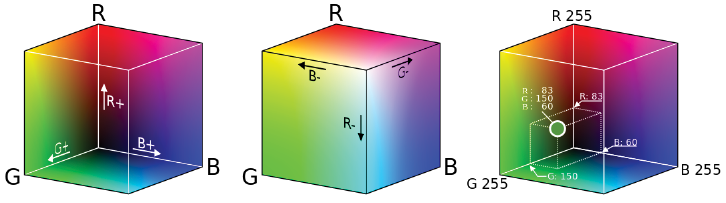
Note. The R, G, and B axes and their corresponding positive directions are shown on the left. In the center we see the cube’s external faces and the negative R, G, and B directions, while on the right, we see how an inside point is represented in the RGB color model. Source: Maklaan (2015).
2.2 K-means clustering
K-means is also known as Lloyd–Forgy algorithm (Lloyd, 1982; Forgy, 1965). An unsupervised clusterization system divides objects into k groups depending on their attributes. Each of the data points will be allocated to a cluster with the closest mean, and the “centroid” or “center” of any cluster is its mean. Na et al. (2010) explain that the algorithm consists of two phases. First, select k centers randomly and later take each data object to the nearest center, commonly using Euclidian distance. Once all objects belong to one cluster, an iterative process of recalculating the average of the earlier clusters is done. After the criterion function becomes the minimum, the algorithm finishes. We can formalize such a process with the following formula:

Where:
If xi ∈ j Cluster
aij=1
else:
aij=0
E is the criterion function that is minimized, k is the number of clusters, n is the number of objects, xi is the object, and cj is the center of cluster j. The pseudocode is:
K-means clustering algorithm pseudocode
Input:
X = {x1,x2,…,xn} //Set of n data objects
k //Number of desired clusters
Output:
A set of k clusters.
Step:
Begin
1. Randomly choose k objects from X as initial centroids.
2. Repeat
Assign each item xi to the cluster with the nearest centroid.
Calculate the new mean for each cluster
Until convergence criteria are met.
End
3. PROPOSED ALGORITHM
A general overview of our approach is presented in figure 5.
Figure 5
General overview of our proposed approach
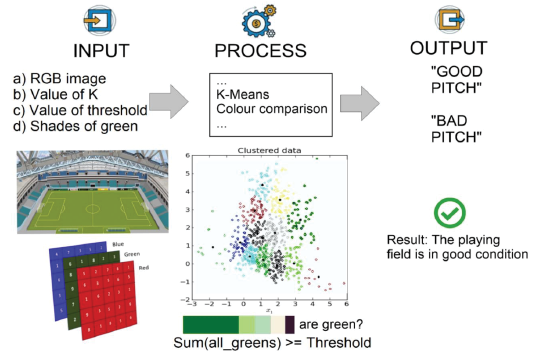
As far as we know, our work is the first to focus on football pitch condition analysis. Our technique to determine if an image shows a football field in good condition is mainly based on identifying dominant colors and the percentage of pixels assigned to them for later determining if they are considered a shade of green. If the total percentage of shades of green is greater than a threshold value, the pitch is considered in good condition; otherwise, it isn’t. Each centroid in k clusters represents a dominant color in the input RGB image. Only the football pitch region should be processed, avoiding other regions; that is why a method to crop only the pitch is needed.
Proposed algorithm pseudocode to determine the condition of a football playing field
Input:
Image //Input image as an RGB array containing a football pitch
K //Number of clusters
Threshold //Value of Threshold
Shades_of_green //RGB array containing all shades of green
Output:
Result //Result after applying our approach
Step:
Begin
1. Apply K-means clustering to the Image using the RGB color model.
2. Obtain proportions of pixels assigned to each dominant color.
3. Create a variable Percentage = 0.
4. Repeat
FOR EACH i=dominant color: IF i is in Shades_of_green.
Percentage = Percentage + Proportions(i).
//Proportions(i) returns the percentage of pixels assigned to i
5. IF Percentage > Threshold //Threshold value
Result = “Pitch in good condition”
6. ELSE
Result = “Pitch in bad condition”
End
Optionally, we can apply a color correction, sharpening technique, and noise removal to the image before processing it. A set of RGB colors can be chosen in advance to decide if a color is a shade of green; however, this decision is somewhat subjective because not everyone agrees on what constitutes green. The image should ideally display an empty pitch (no players, no stands, etc.). It is preferable to use pictures that display as much of the field as possible, like airborne images in optimal resolution.
4. RESULTS
4.1 Prototype
We developed a prototype coded in Python. The modules that we used are: opencv-python: not official pre-built CPU-only OpenCV (Computer Vision library) packages; NumPy: the core Python module for scientific computing; scikit-learn: tools for predictive data analysis that are simple and efficient; tkinter: (“Tool kit interface”) is the standard Python interface to the Tool Command language/Tk graphical user interface toolkit; Pillow: The Python Imaging Library extends the capabilities of the Python interpreter to include image processing. In table 1 we present the usage that we are doing with these modules:
Table 1
Python modules usage
|
Module name |
Usage |
|
opencv-python |
|
|
NumPy |
To remove black pixels from the mask and array manipulation. |
|
scikit-learn |
For applying k-means directly to RGB pixels. |
|
Tkinter |
To create frames, canvas, file dialogs, buttons, and text regions. |
|
Pillow |
To create and modify Tkinter BitmapImage and PhotoImage objects. |
We manually delineate the football pitch region, drawing a polygon with the mouse as explained below. The resulting image is processed, ignoring the black color (color of the mask).
In our prototype, we consider a value of 6 for k, and there are different ways to determine this value. We are using the “values of K equated to the number of classes” method (Pham, S., & Nguyen, 2005). This seems a reasonable choice for this purpose, considering possible classes such as a few shades of green, dirt detection, dead grass, white marking lines, and other possible objects. We consider a pitch in good condition if at most one-fifth is not green. This value is just for testing purposes. Therefore, our threshold value is equal to 80.
Our prototype is available in the GitHub repository1. A normal execution flow of our software solution presented in figure 6 is:
1. Choose a file image (JPG, PNG, etc.) (1).
2. The image is loaded in the visualization area (2).
3. Draw a polygon using the mouse over the region to delimiter where the football playing field is present, considering:
Left-click to add points to the polygon.
Double left-click to finish the polygon.
Right-click to remove the polygon.
4. Once the cropping polygon is finished and shown in red, press Perform K-means button.
5. Obtained results are shown, including the final verdict about the condition of the pitch. The 6 colors of the centroids are also shown in (3) and their proportions in a histogram (4).
Figure 7 shows an example of the result when a pitch in bad condition is processed.
Figure 6
The interface of our developed prototype
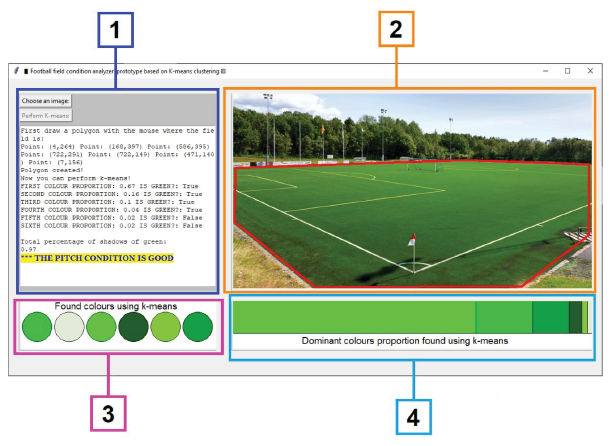
Note. (1) Buttons and results frame, (2) Visualization area frame, (3) The six dominant colors frame, (4) Dominant colors histogram frame.
4.2. Experiments
Our experiments were conducted using the Python Language (version 3.8.5) on a 2.70GHz Intel Xeon E-2176M CPU with 22.0 GB of RAM memory and running Windows 10 version 21H2 as the operating system.
Even though our approach is based on unsupervised learning, we need a useful statistic for validation. We decided to use “external cluster validation” and compare our results with known (labeled) images. (Kassambara, n.d.). We used 80 different images of football pitches from around the world that we found using internet search engines. These photos were captured at different times of the day and from various viewpoints. As previously noted, we prefer images that solely show the playing field and no other objects for greater accuracy. By simple human visual inspection, 40 images show pictures in good condition, and 40 show pictures in bad condition. Table 2 summarizes the findings.
Table 2
Experiments results for our approach and prototype
|
Condition |
Expected quantity |
Obtained Quantity |
Accuracy |
|
Good playing field |
40 |
38 |
95 % |
|
Bad playing field |
40 |
33 |
82,5 % |
5. CONCLUSIONS AND FUTURE WORK
The proposed method using k-means clustering and color comparison with shades of green was able to identify the condition of a football pitch. Based on the results, we examined our allocator’s accuracy and can conclude that our prototype performs well with high accuracy in both cases (95 % and 82,5 %): good and bad pitch conditions.
Some work that we plan to do in the future:
- Research other possible learning techniques and methods such as supervised learning.
- Test with other parameter values such as k, threshold, and shades of green and measure results from accuracy.
- Try with color models different from RGB that could be closer to how humans perceive colors.
- Recognize the football pitch region automatically from an image and possible external elements that should not be processed.
- Consider more possible outputs than “regular condition pitches”.
- Process images in high resolution much faster using GPU processing power and CUDA parallel programming and permit batch image processing.
Carter, W. (2020). Corner flag in the soccer field at Brastad arena [Photograph]. Wikimedia Commons. https://commons.wikimedia.org/wiki/File:Soccer_field_at_Brastad_arena_6.jpg
El País. (2018, November 9). Así fue como pintaron el césped del Centenario de verde. https://www.elpais.com.uy/ovacion/futbol/asi-pintaron-cesped-centenario-verde.html
Football NSW Limited. (2015, November 6). Field marking & equipment. A guide to preparing your field for football. https://footballnsw.com.au/wp-content/uploads/2017/06/Field-Markings-and-Equipment.pdf
Forgy, E. W. (1965). Cluster analysis of multivariate data: efficiency versus interpretability of classifications. Biometrics, 21, 768-780.
Kassambara, A. (n.d.). Cluster validation statistics: Must know methods. Datanovia. https://www.datanovia.com/en/lessons/cluster-validation-statistics-must-know-methods/
Lloyd, S. (1982). Least squares quantization in PCM. IEEE Transactions on Information Theory, 28(2), 129–137. https://doi.org/10.1109/TIT.1982.1056489
Loesdau, M., Chabrier, S., & Gabillon, A. (2014). Hue and Saturation in the RGB Color Space. In A. Elmoataz, O. Lezoray, F. Nouboud, & D. Mammass, (Eds), Image and Signal Processing. ICISP 2014. Lecture Notes in Computer Science, vol 8509. Springer. https://doi.org/10.1007/978-3-319-07998-1_23
Maklaan. (2015) A RGB color cube explained with three diagrams [Diagram]. Wikimedia Commons. https://commons.wikimedia.org/wiki/File:RGB_color_cube.svg
Na, S., Xumin, L., & Yong, G. (2010). Research on k-means clustering algorithm: An improved k-means clustering algorithm. In F. Yu, X. Peng, H. Liu, J. Shiu, & R. Ng (Eds.), Proceedings of the Third International Symposium on Intelligent Information Technology and Security Informatics (pp. 63-67). IEEE Computer Society; Conference Publishing Services. https://doi.org/10.1109/IITSI.2010.74
Pavan Kumar, I., Hara Gopal, V. P., Ramasubbareddy, S., Nalluri, S., & Govinda, K. (2020). Dominant color palette extraction by k-means clustering algorithm and reconstruction of image. In K. Raju, R. Senkerik, S. Lanka, & V. Rajagopal (Eds.), Data engineering and communication technology, vol 1079 (pp. 921–929). Springer Singapore. https://doi.org/10.1007/978-981-15-1097-7_78
Pham, D. T., Dimov, S. S., & Nguyen, C. D. (2005). Selection of K in K-means clustering. Proceedings of the Institution of Mechanical Engineers, Part C: Journal of Mechanical Engineering Science, 219(1), 103-119. https://doi.org/10.1243/095440605X8298
Radovanović, B. (2011). NK Zelengaj football pitch in Dugave neighborhood, Zagreb, Croatia [Photography]. Wikimedia Commons. https://commons.wikimedia.org/wiki/File:NK_Zelengaj_football_pitch_20110918_3186.jpg
Rhyne, T.-M. (2016). applying color theory to digital media and visualization. CRC Press. https://doi.org/10.1145/2776880.2792696
Sharma, A. (2021, December 9). How to find the most dominant colors in an image using kmeans clustering —with source code— interesting project. Towards Dev. https://towardsdev.com/how-to-find-the-most-dominant-colors-in-an-image-in-python-using-kmeans-clustering-with-source-527ef3e6775f
Solomon, C. & Breckon, T. (2011). Fundamentals of digital image processing: A practical approach with examples in Matlab. John Wiley & Sons, Ltd. https://doi.org/10.1002/9780470689776
Stockman, G., & Shapiro, L. G. (2001). Computer vision. Pearson.
Szymanski, S. (2014). It’s football not soccer. http://ns.umich.edu/Releases/2014/June14/Its-football-not-soccer.pdf