Predicting Employee Turnover
Using Applied Machine Learning
Marcos Antonio Albarracin Manrique*
https://orcid.org/0000-0002-3429-0267
Instituto de Física, Universidad de Sao Paulo, Brasil
Received: May 19, 2025 / Accepted: July 10, 2025
Published: December 19, 2025
doi: https://doi.org/10.26439/ing.ind2025.n049.7934
ABSTRACT. Employee turnover is a fundamental process within organizations, reflecting the number of employees who leave a company within a specified timeframe. High turnover incurs substantial costs, so comprehending its causes and implementing corrective actions is crucial for maintaining acceptable levels of employee retention. This article uses predictive models to analyze employee turnover. The researcher developed and compared two machine learning algorithms (Binary Logistic Regression and Random Forest) and one deep learning algorithm (Artificial Neural Networks), utilizing the IBM dataset available on Kaggle. The article is structured in five parts: an introduction to the problem, methodological development, analysis of results, discussion, and conclusion. The findings indicate that neural networks are more efficient at prediction. Ultimately, the use of predictive models can help companies anticipate turnover, optimize selection processes, and promote more ethical and proactive human resource management.
KEYWORDS: machine learning / neural networks / labor turnover / forecasting / ensemble learning / logistic regression analysis
Este estudio no fue financiado por ninguna entidad.
* Corresponding author.
E-mail address: [email protected], [email protected]
Este es un artículo de acceso abierto, distribuido bajo los términos de la licencia Creative Commons Attribution 4.0 International (CC BY 4.0).
APRENDIZAJE AUTOMÁTICO APLICADO PARA PREDECIR
LA ROTACIÓN DE EMPLEADOS EN UNA EMPRESA
RESUMEN. La rotación de personal es un proceso natural en las organizaciones que refleja la cantidad de empleados que dejan la empresa en un periodo determinado. Una alta rotación genera costos significativos, por lo que comprender sus causas y planificar acciones correctivas es esencial para mantener la rotación de personal en niveles aceptables. Este artículo analiza la rotación en organizaciones mediante modelos predictivos. Se desarrollaron y compararon dos algoritmos de aprendizaje automático (regresión logística binaria y bosque aleatorio) y uno de aprendizaje profundo (redes neuronales artificiales), utilizando el conjunto de datos de IBM disponible en Kaggle. El artículo se estructura en cinco partes: introducción al problema, desarrollo metodológico, análisis de resultados, discusión y conclusión. Las redes neuronales demostraron mayor eficiencia en la predicción. Se concluye que el uso de modelos predictivos puede ayudar a las empresas a anticipar la rotación, optimizar procesos de selección y fomentar una gestión de recursos humanos más ética y proactiva.
PALABRAS CLAVE: aprendizaje automático / redes neuronales / rotación de personal / pronósticos / aprendizaje conjunto / análisis de regresión logística
INTRODUCTION
In recent years, researchers have applied Machine Learning (ML) across various fields, including the assessment of real estate prices (Albarracin & Souza, 2021), enhancement of security and privacy protocols (Wassan et al., 2022), detection of phishing websites (Almomani et al., 2022), identification of malware detection in IoT devices (Gaurav et al., 2023), forecasting sales for companies (Soltaninejad et al., 2024), and evaluation of credit scoring (El Maanaoui et al., 2024), among many others areas within the applied sciences.
Employee turnover poses a significant challenge for the Human Resources (HR) and personnel departments. Organizations actively monitor turnover rates to gain insights into the dynamics surrounding employee entry and exit. Each instance that a company replaces an employee incurs both direct and indirect costs, highlighting that employees are essential contributors to all aspects of a company. These costs include human resource expenses, advertising expenditures, lost productivity, customer retention efforts, and the training of new hires, among others. Consequently, the ongoing loss of talent adversely affects a company’s success (Duda & Žůrková, 2013; Cloutier et al., 2015; Al-Suraihi et al., 2021; Vasantham & Aithal, 2022).
A high turnover rate raises significant concerns because it directly impacts productivity and business outcomes. Researchers identify four types of employee turnover: voluntary, involuntary, functional, and dysfunctional. Each type arises from various factors, such as improved working conditions, competitive job offers, retirement, underperformance, challenges in adapting to the organizational culture, misconduct, or cost-cutting measures. Each category of turnover exerts different levels of impact, resulting in detrimental effects on the organization. Despite these varying impacts, all types of turnover pose considerable challenges and create ongoing issues for companies, ultimately undermining their competitiveness (Gundlach, 2025; Hur & Abner, 2023; Pelly, 2023; Wang & Sun, 2020; An, 2019).
Employee turnover has significant repercussions for organizations, including the loss of institutional knowledge, increased workloads for remaining staff, and decreased morale. More importantly, turnover signals potential issues that affect employee satisfaction and engagement. A notable number of departures raises concerns about the organization’s ability to attract prospective candidates, maintain productivity, ensure profitability, and negotiate effectively with customers and stakeholders. Therefore, understanding the reasons behind employee turnover is essential for organizations. While individuals frequently attribute employee turnover to personal decisions, organizations play a crucial role in this phenomenon. Organizations significantly shape the work environment and actively influence employee choices through their actions and policies (Tuzun & Kalemci, 2012; Ribes et al., 2017; Dalton & Mesch, 1990).
Replacing an employee imposes significant costs for a company, including human resources, advertising, lost productivity, customer retention, and training for new hires (Adeyefa et al., 2023). Hiring and retaining employees present complex challenges that demand substantial capital, time, and expertise. According to Hiring People, a leading online fixed-fee recruitment company in the UK and a pioneer in this field, small business owners dedicate approximately 40 % of their working hours to non-revenue-generating tasks, such as recruiting. Companies generally allocate 15 % to 20 % of an employee’s salary for recruiting new candidates. On average, companies experience a loss of 1 % to 2,5 % of their total revenue during the training period for a new employee. According to The Society for Human Resource Management (SHRM), hiring a new employee costs an average of $4700 for a company with around 500 employees, a figure that has increased by 14 % over the past five years. Additionally, it takes approximately 52 days to fill a new position (Prokopets, 2024).
Machine Learning (ML) algorithms are transforming industries worldwide (Fernandes & Sharma, 2022). By leveraging historical data and utilizing sophisticated algorithms, these systems emulate human learning, continuously enhancing their accuracy and capabilities (Russell & Norvig, 2021; Kelleher et al., 2015; Kelleher, 2019; Kelleher & Tierney, 2018). The influence of ML is evident in everyday applications, ranging from mobile banking to personalized recommendations on social media (Sadiku et al., 2021). ML automates intricate processes, thereby improving decision-making, identifying market gaps, and fostering innovation. The primary advantages of ML include increased efficiency, time savings, enhanced customer responsiveness, and superior decision-making. The relevance of Artificial Intelligence (AI), particularly its ML subset, aligns closely with the issue of employee turnover, presenting a viable solution for predicting turnover rates. Nonetheless, organizations can only reap the benefits of accurate turnover predictions—by identifying root causes, enhancing employee engagement, and boosting performance—if they obtain reliable results from algorithms that effectively inform decision-making processes.
Machine learning algorithms significantly influence predictions of employee turnover within companies (Fallucchi et al., 2020; Sharma & Sharma, 2023; Park et al., 2024; Nagpal et al., 2024; Solomon et al., 2024). Over the past two decades, researchers have increasingly focused on turnover from various perspectives, including job-specific factors, emotional assessments, resource constraints, demographic attributes, and absenteeism. Furthermore, they have dedicated efforts to improve the accuracy of the employed ML models (Rombaut & Guerry, 2018; Saradhi & Palshikar, 2011; Juvitayapun, 2021; Alsubaie & Aldoukhi, 2024; Veglio et al., 2024).
Utilizing multiple algorithms is always preferable, as analyzing a variety of algorithms in data science is crucial for identifying the one that yields the best performance. This study examines the factors influencing employee turnover to help companies make data-driven decisions. To achieve this aim, we employ three ML algorithms: Binary Logistic Regression, Random Forest, and Artificial Neural Networks (ANN), with the latter associated with Deep Learning (DL) algorithms. The objective is to enhance the accuracy of predicting employee turnover by applying these models. This paper is structured as follows: Section 2 details the methodology, including an Exploratory Data Analysis (EDA) of the features—an important step in the AI algorithm pipeline. Section 3 presents the results, Section 4 discusses each model in depth, and Section 5 concludes the study.
METHODOLOGY
This section presents the methodology used to analyze employee turnover prediction. The approach consists of several interconnected stages, starting with data collection, then moving to data cleaning, data exploration, and statistical analysis. We detail the ML algorithms used to identify complex patterns in the data and discuss the initial results from their performance evaluations. The entire process was implemented using Python software.
This study adopts a descriptive analytical approach to investigate the phenomenon of employee turnover within a company. To achieve this objective, we utilize a fictitious dataset developed by IBM data scientists (Subhash, 2017). This dataset contains information on 1 470 employees and includes 35 variables, each presented with its respective levels in Tables 1 and 2. The tables record relevant data on the factors influencing turnover. This fictitious database effectively simulates a historical dataset typically collected by the human resources department of a large organization.
This fictitious dataset presents significant limitations compared to real datasets. A primary limitation is the absence of null or incompletely filled data, which is a common occurrence in real datasets. Real datasets often include null or inadequately filled values due to several factors. For instance, employees may refuse to provide information when completing questionnaires, submit responses after the deadline, or offer answers that lack depth, truthfulness, or a clear understanding of the requested information, among other issues.
Table 1
Variables and corresponding levels
|
Variable |
Type |
Levels |
|
Age |
Continuous |
18 – 60 |
|
Attrition |
Nominal |
No = 0, Yes = 1 |
|
Business Travel |
Ordinal |
1 = Non_Travel, 2 = Travel_Rarely, 3 = Travel_Frequently |
|
Daily Rate |
Continuous |
102 - 1 499 |
|
Department |
Nominal |
1 = Human Resource, 2 = Research & Development, |
|
Distance from Home |
Continuous |
1 – 29 |
|
Education |
Ordinal |
1 = Below College, 2 = College, 3 = Bachelor, 4 = Master, |
|
Education Field |
Nominal |
1 = Human Resource, 2 = Life Sciences, 3 = Marketing, |
|
Employee Count |
Discrete |
1 |
|
Employee Number |
Discrete |
1 - 2 068 |
|
Environment |
Ordinal |
1 = Low, 2 = Medium, 3 = High, 4 = Very High |
|
Gender |
Nominal |
0 = Female, 1 = Male |
|
Hourly Rate |
Continuous |
30 – 100 |
|
Job Involvement |
Ordinal |
1 = Low, 2 = Medium, 3 = High, 4 = Very High |
|
Job Level |
Ordinal |
1, 2, 3, 4, 5 |
|
Job Role |
Ordinal |
1 = Sales Executive, 2 = Research Scientist, |
|
Job Satisfaction |
Ordinal |
1 = Low, 2 = Medium, 3 = High, 4 = Very High |
|
Marital Status |
Nominal |
1 = Divorced, 2 = Married 3 = Single |
|
Monthly Income |
Continuous |
1 009 – 19 999 |
|
Monthly Rate |
Continuous |
2 094 - 26 999 |
Table 2
Variables and corresponding levels
|
Variable |
Type |
Levels |
|
Num Companies Worked |
Continuous |
0 – 9 |
|
Over18 |
Nominal |
0 = No, 1 = Yes |
|
Overtime |
Nominal |
0 = No, 1 = Yes |
|
Percent Salary Hike |
Continuous |
11 – 25 |
|
Performance Rating |
Ordinal |
1 = Low, 2 = Good, 3 = Excellent, 4 = Outstanding |
|
Relationship Satisfaction |
Ordinal |
1 = Low, 2 = Medium, 3 = High, 4 = Very High |
|
Standard Hours |
Discrete |
80 |
|
Stock Option Level |
Ordinal |
0, 1, 2, 3, 4 |
|
Total Working Years |
Continuous |
0 – 40 |
|
Training Times Last Year |
Continuous |
0 – 6 |
|
Work-Life Balance |
Ordinal |
1 = Bad, 2 = Good, 3 = Better, 4 = Best |
|
Years at Company |
Continuous |
0 - 40 |
|
Years in Current Role |
Continuous |
0 - 18 |
|
Years Since Last Promotion |
Continuous |
0 - 15 |
|
Years with Current Manager |
Continuous |
0 - 17 |
Most real-world datasets remain unstructured, necessitating cleaning and conversion into structured formats before analysis or modeling. However, this study utilizes an ideal dataset that allows us to omit the data-cleaning step. In the context of exploratory data analysis, we aim to uncover hidden patterns within the dataset. To achieve this, we analyze various factors influencing the target variable and evaluate the extent of their impact. This analysis involves examining the relationships among independent variables, with specific attention to multicollinearity, and identifying strategies to achieve the desired outcomes. This process provides a clear direction as the researcher initiates the modeling process. To uncover insights from the underlying characteristics of the dataset, the researcher performed an exploratory analysis. This analysis used graphical representations and descriptive statistical methods to examine the dataset, which resulted in several significant conclusions.
Table 3 illustrates that three variables (EmployeeCount, Over181 and StandardHours) present only a single value, rendering their contributions to the analysis negligible. The table also includes a fourth variable, EmployeeNumber, which assigns a unique ID to each observation (employee). To enhance the robustness of our model and reduce the risk of overfitting, the researcher removed these non-informative variables from the analysis.
Conducting a basic statistical analysis enables us to gain initial insights by comparing the number of employees who left the company to those who remained. Analyzing the Attrition variable, which indicates an employee’s likelihood of leaving, reveals that out of the 1470 employees in the dataset, 237 employees departed. This figure represents approximately 16 %, while the remaining 1233 employees account for about 84 %.
Table 3
Statistical summary of variables not significant for the model
|
EmployeeCount |
EmployeeNumber |
Over18 |
StandardHours |
|
|
count |
1 470,0 |
1 470,0 |
1 470,0 |
1 470,0 |
|
mean |
1,0 |
1 024,87 |
1,0 |
80,0 |
|
Std |
0,0 |
602,02 |
0,0 |
0,0 |
|
Min |
1,0 |
1,00 |
1,0 |
80,0 |
|
25 % |
1,0 |
491,25 |
1,0 |
80,0 |
|
50 % |
1,0 |
1 020,50 |
1,0 |
80,0 |
|
75 % |
1,0 |
1 555,75 |
1,0 |
80,0 |
|
Max |
1,0 |
2 068,00 |
1,0 |
80,0 |
Analyzing the variables Age, DailyRate, and DistanceFromHome separately for employees who left the company and those who chose to stay reveals significant insights. Tables 4 and 5 show that the mean Age indicates younger individuals are more likely to leave the company. The DailyRate analysis demonstrates that employees who remain with the company tend to earn higher salaries than those who exit. This suggests that departing employees may seek better job opportunities that offer more competitive compensation.
Regarding DistanceFromHome, the average indicates that employees who left the company generally live farther from the company than their counterparts who stayed. In terms of EnvironmentSatisfaction, the data reveal that departing employees report lower satisfaction than their counterparts who stayed, suggesting that the latter group generally experiences a greater level of satisfaction with their work environment. Finally, regarding the Education variable, employees who left the company have a lower average educational attainment than those who remained employed.
The findings indicate that individuals with higher levels of education typically earn greater salaries, which may incentivize them to remain with the company. In contrast, employees with lower educational qualifications are more prone to leaving. Utilizing this information, the company can implement strategies such as offering discounts on tuition fees or providing assistance with postgraduate course costs, for example. As a result, employees who attain higher levels of education can expect to earn increased salaries and exhibit a higher likelihood of continued employment with the organization.
In conducting a correlation analysis using the Chi-Square test, the researcher identified a strong correlation between the variable Attrition and several categorical variables, including JobLevel, JobRole, MaritalStatus, OverTime, and StockOptionLevel. These correlations become evident through significant differences in the distributions of each variable for employees who left the company compared to those who remained. For instance, the MaritalStatus variable, which categorizes individuals as Single, Married, and Divorced, reveals significant differences between employees who left the company and those who chose to stay, as shown in Figure 1. The data indicates that married employees are more likely to remain with the company, likely due to family responsibilities that drive them to prioritize stability over risk-taking, in contrast to their single counterparts. Researchers can apply a similar analysis to other qualitative variables.
Table 4
Comparisons of the basic statistical parameters of Age, DailyRate, and DistanceFromHome among employees who chose to leave versus those who decided to remain
|
Age_left |
Age_stayed |
DailyRate_left |
DailyRate_stayed |
Distance |
Distance |
|
|
Count |
237,0 |
1233,0 |
237,0 |
1233,0 |
237,0 |
1233,0 |
|
mean |
33,6 |
37,6 |
750,4 |
812,5 |
10,6 |
8,9 |
|
std |
9,7 |
8,9 |
401,9 |
403,2 |
8,5 |
8,0 |
|
min |
18,0 |
18,0 |
103,0 |
102,0 |
1,0 |
1,0 |
|
25 % |
28,0 |
31,0 |
408,0 |
477,0 |
3,0 |
2,0 |
|
50 % |
32,0 |
36,0 |
699,0 |
817,0 |
9,0 |
7,0 |
|
75 % |
39,0 |
43,0 |
1092,0 |
1176,0 |
17,0 |
13,0 |
|
max |
58,0 |
60,0 |
1496,0 |
1499,0 |
29,0 |
29,0 |
Table 5
Comparison of basic statistical parameters between variables Education and EnvironmentSatisfaction for employees who left and decided to stay
|
Education_left |
Education_stayed |
Environment |
EnvironmentSatisfaction_stayed |
|
|
count |
237,0 |
1233,0 |
237,0 |
1233,0 |
|
mean |
2,8 |
2,9 |
2,5 |
2,8 |
|
std |
1,0 |
1,0 |
1,2 |
1,1 |
|
min |
1,0 |
1,0 |
1,0 |
1,0 |
|
25 % |
2,0 |
2,0 |
1,0 |
2,0 |
|
50 % |
3,0 |
3,0 |
3,0 |
3,0 |
|
75 % |
4,0 |
4,0 |
4,0 |
4,0 |
|
max |
5,0 |
5,0 |
4,0 |
4,0 |
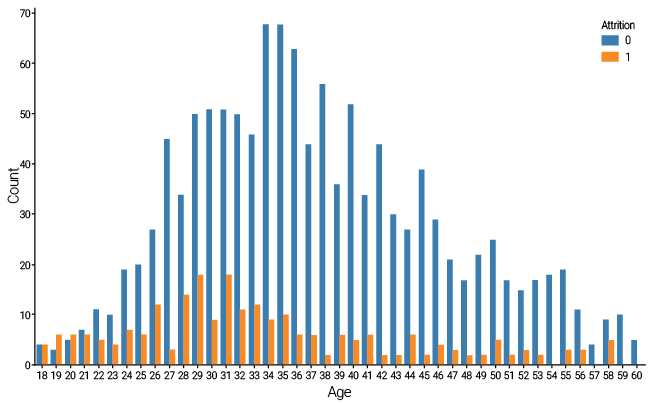
Examining the Pearson correlation between numerical variables yields valuable insights. For example, since single employees tend to have higher turnover rates, we can expect that younger employees will also leave the company in greater numbers. While the correlation between the Attrition and Age variables is not particularly strong, it is negative. The distribution of this correlation is illustrated in Figure 2.
Figure 1
Distribution of the variable MaritalStatus for employees who left and decided to stay
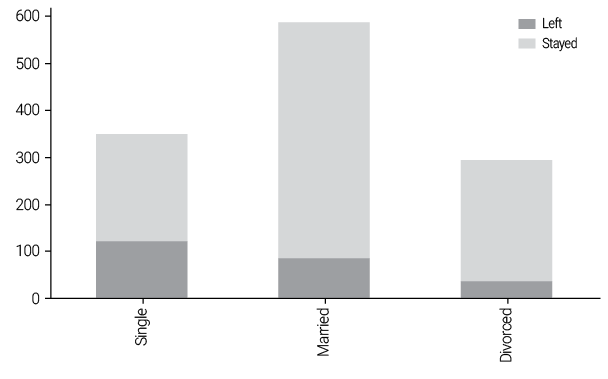
Figure 2
Distribution of the variable Age for employees who left and decided to stay
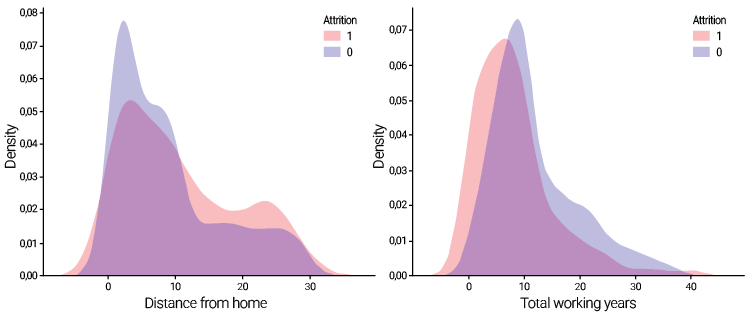
This study reveals a notable trend regarding the DistanceFromHome variable: employees living farther from the company are more likely to leave the organization than those who remain. We can analyze this trend by examining the probability density function through a kernel density estimate (KDE), as illustrated in Figure 3 (left). The analysis demonstrates that the majority of individuals who departed the company reside between 1 and 10 kilometers from their workplace, while additional individuals living between 20 and 30 kilometers from the workplace are also present on the right side of the distribution. In contrast, most employees who stayed with the company work between 1 and 5 kilometers from home. Notably, the proportion of those who remained and lived more than 10 kilometers away is smaller than that of individuals depicted in the red section, which represents the employees who left.
Additionally, we examine the TotalWorkingYears variable, as shown in Figure 3 (right). This analysis reveals that the density of individuals who continue with the company surpasses that of those who depart, indicating that employees who remain tend to have accumulated more years of experience throughout their careers than those who leave. Moreover, this characteristic correlates with age, as younger individuals generally exhibit a greater propensity to seek alternative employment opportunities.
Figure 3
Probability density function of the variable (left) DistanceFromHome and (right) TotalWorkingYears, for employees who left and decided to stay
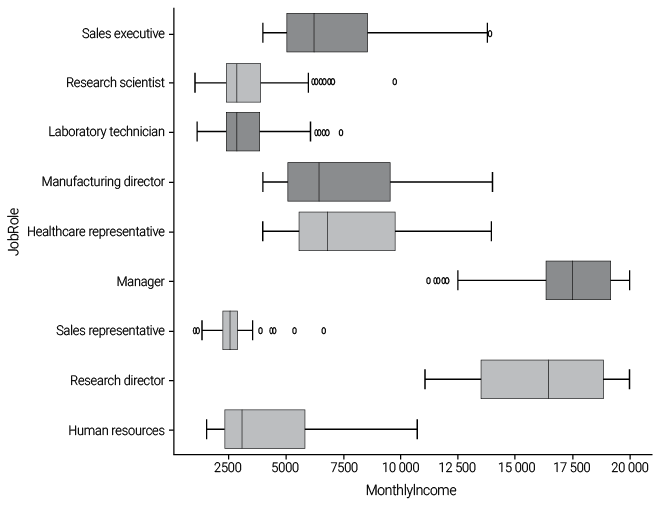
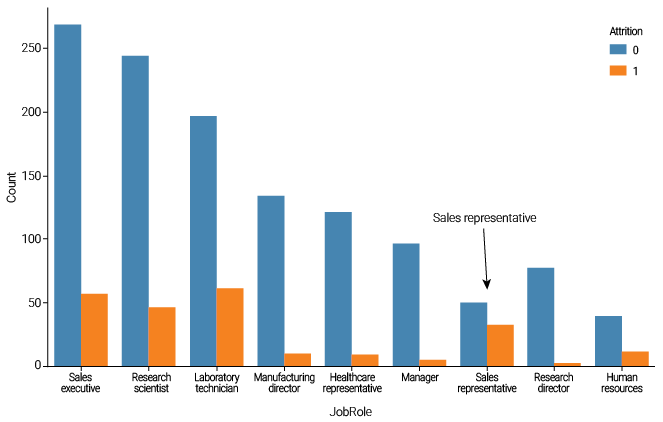
In this section, we will analyze the relationship between MonthlyIncome and JobRole using boxplot visualizations. The data reveals that employees occupying the roles of Manager and Research Director earn the highest salaries, as indicated by their placement further to the right on the boxplot compared to other positions. Salaries for the remaining job roles are relatively similar; however, the Sales Representative position has the lowest salary, as illustrated in Figure 4. Furthermore, Figure 5 shows that the Sales Representative area has the highest employee turnover in the company, likely attributable to insufficient salaries.
Figure 4
Boxplot for the variables MonthlyIncome and JobRole
To predict which employees are most likely to leave the company using various ML algorithms, researchers must follow several essential steps. Among these, data preprocessing, also known as feature engineering, plays a crucial role. This study will examine several key parameters and procedures applied to the data prior to training, evaluating, and implementing the model. The preprocessing tasks will include addressing missing values, scaling numerical features, normalizing and standardizing data, encoding categorical variables, and dividing the dataset into training and test sets. The researcher will adopt the conventional division of 75 % for the training group and 25 % for the test group. This systematic approach will enhance the training phase and enable a thorough evaluation of the algorithm’s performance on unseen data.
This study employs three ML models: Binary Logistic Regression, Random Forest, and Artificial Neural Networks (ANN). The researcher based the selection of these algorithms on their effectiveness and interpretability in solving binary response variable problems. Several excellent resources offer detailed descriptions of these algorithms. Including notable works by Murphy (2022; 2023), Marsland (2014), James et al. (2023), and Goodfellow et al. (2016).
Figure 5
Distribution of the variable JobRole for employees who left and decided to stay
In contrast to the study by Alsubaie and Aldoukhi (2024), the researcher integrated an ANN algorithm into this study. ANN represents a segment of the deep learning domain, currently recognized for housing some of the most effective algorithms across a wide array of applications. However, it is essential to acknowledge that ascribing contributions from various factors within artificial neural networks presents inherent challenges.
Unlike traditional statistical models, neural networks (NN) do not easily identify the most statistically influential input factors. This limitation stems from the complexity of NNs, which obscures the relationships between their inputs and outputs (Hastie et al., 2009). This challenge poses a significant barrier to the acceptance of NNs in contemporary decision-making systems. Therefore, while NN models can produce satisfactory results if prediction is the sole objective, models such as Binary Logistic Regression also enhance our understanding of how various factors influence classification.
Approximately 16 % of the cases in our dataset represent employees who have left the company, highlighting a significant imbalance within the dataset. In such contexts, relying exclusively on precision can be misleading. Consequently, the researcher decided to use the F1-score as an evaluation metric, as it provides a more robust assessment, particularly when the minority class is of special interest. By considering both precision and recall, the F1-score offers a fair representation of model performance, even in the presence of class imbalance. The F1-score ranges from 0 to 1, with the best value at 1 and the worst at 0. The researcher focused the analysis on the F1-score for the minority class instead of global metrics, which may obscure the model’s true predictive capability.
The feasibility of implementing these models depends on the organization’s HR systems and data quality. To effectively predict employee turnover, it is essential to ensure access to high-quality data, integrate with existing systems, and consider ethical and legal implications. Failing to address these factors may impede the adoption and effectiveness of the model.
RESULTS
In the field of AI, ML serves as a robust tool for transforming data into valuable insights and predictions. However, selecting the suitable algorithm for a specific problem presents significant challenges. Each algorithm has distinct strengths and weaknesses, making the optimal choice dependent on the characteristics of the data, the nature of the problem, and the available computational resources. To prevent overfitting, the researcher employed L2 regularization techniques for the Binary Logistic Regression algorithm and applied dropout for the ANN algorithm. Additionally, the study eliminated correlated or irrelevant variables during the Exploratory Data Analysis (EDA) process.
This study implements models using Python software, specifically leveraging the open-source ML library Scikit-learn (Pedregosa et al., 2011). While scikit-learn provides implementations of NNs, the researcher chose to utilize the open-source libraries TensorFlow and Keras. These powerful and accessible tools enable us to create and train ANNs to detect and interpret patterns and correlations in data, much like human learning and reasoning. Furthermore, they are optimized for deep learning and graphics processing units (GPU) (Géron, 2019).
BINARY LOGISTIC REGRESSION ALGORITHM
Multicollinearity in regression analysis arises when independent variables exhibit a high degree of correlation, which undermines the reliability of statistical interpretations (Hastie et al., 2009; Efron & Hastie, 2016). In our analysis, we applied the Generalized Variance Inflation Factors (GVIF) technique, as outlined by Alsubaie and Aldoukhi (2024). This analysis revealed that the variables Department and Job Role display significant multicollinearity, with Department particularly notable for far exceeding the threshold value of 5, while Job Role hovers around this boundary. Therefore, the researcher opted to eliminate the Department variable from the analysis, a decision further supported by the results of the Chi-Square test comparing the two variables.
Given the presence of class imbalance, we must optimize the model. The analysis is based on the weights assigned to each class. To achieve this optimization, we adjust the weights inversely in relation to class frequencies within the data. The results are presented in Table 6, where we find that the model achieves an accuracy of 76 %. This indicates that every time we classify an employee’s likelihood of remaining with the company using the database, we achieve a 76 % accuracy rate in our predictions. Such a level of accuracy constitutes an acceptable outcome for our analysis.
In addressing an unbalanced database, it is crucial to conduct a thorough analysis of the model by examining the values of precision, recall, and F1-score. To gain insights, we will evaluate these metrics specifically for employees who left the company, i.e., those classified as Attrition = 1. The results indicate that the precision stands at 30 %, meaning that when the model predicts an employee will leave the company, it is correct only 30 % of the time. For example, if we input the data of a new employee into the algorithm and it predicts that the employee will leave, the algorithm achieves accuracy in only 30 % of cases, reflecting a relatively low level of reliability.
The model demonstrates a recall rate of 62 %, indicating its ability to accurately identify 62 % of the employees likely to leave the company. Although this figure provides some insight, it remains relatively low. Each time the algorithm processes an employee’s data, the probability of correctly predicting their departure stands at only 62 %. Furthermore, in terms of precision, the analysis reveals that when the algorithm predicts an employee’s departure, the likelihood of that prediction being accurate is only 30 %.
The current recall and precision values are suboptimal, necessitating improvement of these metrics. The algorithm struggles to accurately identify individuals likely to leave the company, largely due to the existing imbalance in the database. Initially, the researcher achieved an accuracy of 76 %; however, this figure demonstrates that it is not a reliable measure for assessing the performance of the algorithm.
The F1-score achieved is 41 %, which falls short of the objectives. However, upon analyzing the Macro Avg and Weighted Avg, it is noted the F1-score improves. To enhance the model’s performance metrics, the researcher refined the approach by focusing on the 11 most significant features identified through the Recursive Feature Elimination (RFE) technique.
Table 6
Key Performance Indicators (KPIs) for Binary Logistic Regression algorithm
|
Attrition |
Precision |
Recall |
F1 Score |
Test Set |
|
0 |
0,93 |
0,78 |
0,85 |
320 |
|
1 |
0,30 |
0,62 |
0,41 |
48 |
|
Accuracy |
0,76 |
368 |
||
|
Macro Avg |
0,62 |
0,70 |
0,63 |
368 |
|
Weighted Avg |
0,85 |
0,76 |
0,79 |
368 |
The selection process ultimately identified 11 key features: JobRole (Manager category), OverTime, Age, EnvironmentSatisfaction, JobInvolvement, YearsInCurrentRole, NumCompaniesWorked, TotalWorkingYears, JobSatisfaction, YearsSinceLastPromotion, and YearsWithCurrManager. As presented in Table 7, the model demonstrated only a modest improvement, suggesting that it fell short of the significant enhancement that was anticipated.
Table 7
KPIs for Binary Logistic Regression algorithm with feature reduction
|
Attrition |
Precision |
Recall |
F1 Score |
Test Set |
|
0 |
0,93 |
0,79 |
0,86 |
320 |
|
1 |
0,30 |
0,66 |
0,42 |
48 |
|
Accuracy |
0,77 |
368 |
||
|
Macro Avg |
0,62 |
0,73 |
0,64 |
368 |
|
Weighted Avg |
0,86 |
0,74 |
0,79 |
368 |
RANDOM FOREST ALGORITHM
Random Forest serves as a widely utilized ML algorithm that randomly generates multiple decision trees and aggregates their outputs to yield a single result. Its user-friendly design and inherent flexibility have led to its broad adoption, as it adeptly tackles both classification and regression challenges. However, the algorithm’s complexity incurs higher computational costs, which are often associated with improved performance (Hastie et al., 2009; Efron & Hastie, 2016).
In the application of the Random Forest algorithm, this study employed the Tree-Based Importance technique to evaluate the significance of features within a tree-based ML model. The researcher defined feature importance using Gini importance, which represents the mean reduction of impurity in the model. This methodology assesses a feature’s importance by quantifying its contribution to reducing impurity at the tree nodes. The analysis identified five key features: MonthlyIncome, OverTime, DailyRate, Age, and TotalWorkingYears. To enhance model performance, we initiated an optimization process employing 10-fold cross-validation, sampling five variables at random in each split, and constructing a total of 104 trees.
In this scenario, the researcher presents the results shown in Table 8. We can draw a parallel interpretation to that of the Binary Regression algorithm, noting that the results shown for the accuracy variable with the Random Forest algorithm are higher. However, it is important to acknowledge that the accuracy variable alone can be misleading. A closer examination of the values for precision, recall, and F1-score reveals that in comparison to Binary Regression, precision experiences a significant increase, while both recall and F1-score demonstrate a substantial decrease. Based on these findings, we conclude that the Random Forest algorithm performs worse than the Binary Regression algorithm discussed in the previous section.
Table 8
Key Performance Indicators (KPIs) for Random Forest algorithm
|
Attrition |
Precision |
Recall |
F1 Score |
Test Set |
|
0 |
0,88 |
0,99 |
0,93 |
320 |
|
1 |
0,71 |
0,10 |
0,18 |
48 |
|
Accuracy |
0,88 |
368 |
||
|
Macro Avg |
0,80 |
0,55 |
0,56 |
368 |
|
Weighted Avg |
0,86 |
0,88 |
0,84 |
368 |
ARTIFICIAL NEURAL NETWORKS ALGORITHM
One of the foremost questions that arises when working with ANN is how many neurons and layers to incorporate into the network’s architecture. The prevailing literature indicates that, in most cases, a single hidden layer is adequate, as this structure can effectively approximate any nonlinear equation. Additionally, two hidden layers can represent any relationship between data, including those that traditional equations cannot express. Typically, researchers require more than two hidden layers only for more complex problems, such as time series analyses and computer vision (Goodfellow et al., 2016).
Depending on the nature of the problem, using too few hidden layers may result in underfitting, while an excessive number of layers can lead to overfitting. In the ANN algorithm, the researcher implemented three hidden layers, in addition to the input layer, which comprises 50 features, and the output layer, which consists of one response. To determine the number of neurons in each layer, the researcher selected a quantity equal to two-thirds of the size of the previous layer, plus the size of the output layer, starting from the input layer. Consequently, the number of neurons in each layer will be 34, 24, and 17, respectively.
In the input and hidden layers, we employ the Rectified Linear Unit (ReLU) as the activation function, widely recognized in the literature on DL models and Convolutional Neural Networks (CNNs). This function is both simple and highly effective, generating a value that is directly proportional to the input. For the activation function in the output layer, the researcher employed the Sigmoid function, commonly referred to as the logistic function.
Selecting an appropriate optimizer for weight adjustments is a critical aspect of the NN model. In this study, the researcher chose the Adaptive Moment Estimation (Adam) optimization algorithm, a technique widely recognized in ML, and particularly in DL. Another important component of an ANN model is the loss function, also known as the error function. The loss function quantifies the effectiveness of the model in performing a specific task, in this case, classification. It calculates the difference between the predicted outputs of the ANN and the actual target values. This difference, referred to as the loss, indicates the accuracy of the model’s predictions. For this study’s model, the researcher employed the binary cross-entropy loss function, which is suitable for classification problems involving only two categories (discrete outputs) and is therefore the most appropriate choice for DL models.
The researcher selected accuracy as the primary metric to monitor during the training of the model, as it is related to the type of loss employed. The researcher recorded the metric values at the conclusion of each epoch on the training dataset. It is essential to clarify that an epoch represents the number of times the algorithm processes the training set, which allows for systematic recording and evaluation. For this model, we determined a total of 200 epochs.
Table 9 clearly indicates that the F1-score is superior to those of the previously analyzed models. The data reveals a distinct balance between precision and recall. In particular, the model demonstrates lower precision and higher recall relative to the Random Forest, while it exhibits higher precision and lower recall compared to Binary Regression. The accuracy of the model remains significantly high, comparable to the two preceding models. Given the issue of data imbalance, the researcher placed greater emphasis on the F1-score. Therefore, this study can conclude that this study’s ANN model yields superior results for predicting employee turnover within the dataset under analysis.
Table 9
Key Performance Indicators (KPIs) for ANN algorithm
|
Attrition |
Precision |
Recall |
F1 Score |
Test Set |
|
0 |
0,92 |
0,93 |
0,92 |
320 |
|
1 |
0,48 |
0,46 |
0,47 |
48 |
|
Accuracy |
0,86 |
368 |
||
|
Macro Avg |
0,70 |
0,69 |
0,70 |
368 |
|
Weighted Avg |
0,86 |
0,86 |
0,86 |
368 |
DISCUSSION
The researcher developed three ML algorithms to predict employee turnover within a company, utilizing a dataset created by IBM. This dataset is widely recognized in the ML community for its clean structure, diverse and relevant attributes, and ease of access, making it suitable for educational purposes and the testing of predictive models. However, it has significant limitations, including synthetic data, organizational perspectives, class imbalance, and a lack of contextual variables, which diminish its external validity. Consequently, researchers should interpret the results with caution and, whenever possible, validate them with real, more representative data.
In the implementation of the Binary Regression algorithm, the researcher applied two approaches, with the second approach incorporating feature reduction to enhance model optimization. The team also tested the Random Forest algorithm using suitably optimized parameters. However, neither of these algorithms surpassed the performance of the ANN algorithm, which demonstrated the highest effectiveness in predicting employee turnover. The ANN algorithm achieved an F1-score of 47 % for the attrition class (Attrition = 1), a metric considered a more reliable indicator of model effectiveness than accuracy alone. Although the accuracy reached 86 %, indicating an 86 % probability of correct classification, the 47 % for the ANN model suggests that its performance is suboptimal despite its notable results for accuracy. This low F1-score indicated that the model struggles to correctly classify employee turnover, potentially due to issues such as class imbalance, overfitting, or inappropriate choice of hyperparameters. To improve performance in future work, it is recommended to apply techniques such as SMOTE (synthetic minority over-sampling technique), fine-tuning of hyperparameters, and stratified cross-validation.
The values indicate that the model accurately identifies 46 % of the employees likely to leave the company. Therefore, whenever an employee’s data is input into the algorithm, there is a 46 % probability that the model will correctly predict their departure. Conversely, when the algorithm predicts that an employee will leave, there is a 48 % likelihood that this prediction is correct. In this context, the ANN algorithm has demonstrated greater efficiency than Binary Regression, which previous research by Alsubaie and Aldoukhi (2024) showed to be more effective. Furthermore, upon examining the values for Macro Avg and Weighted Avg, the researcher finds them to be quite satisfactory compared to the other two algorithms.
The researcher confirmed various insights through Chi-Square tests, RFE, and Gini importance criterion analyses. Notably, the variables Age, OverTime, and TotalWorkingYears exhibit a strong correlation with our target variable, Attrition, and reveal potential relationships with MaritalStatus, DailyRate, MonthlyIncome, and DistanceFromHome. These findings align with expectations; typically, a worker with more years of service is likely to remain employed with the company. This trend is closely tied to the worker’s age and is further influenced by marital status and proximity to the workplace. Conversely, a worker with fewer years at the company who frequently works overtime—whether due to economic necessity or sector demands—might consider leaving for better job opportunities. It is essential to recognize that these characteristics significantly impact the Sales Representative role, as individuals in this position generally receive the lowest salaries within the company.
In conclusion, our findings demonstrate that the incorporation of the ANN algorithm, even when applied in a straightforward manner, yields superior results compared to those currently reported in the literature, particularly in the study by Alsubaie and Aldoukhi (2024). This has revealed several valuable insights applicable to any company.
CONCLUSION
To mitigate employee turnover, companies should adopt several proactive strategies based on these insights. They should establish partnerships with automotive manufacturers or real estate agencies to provide accessible credit options. This strategy enables employees to finance vehicles that enhance their commuting efficiency or secure housing closer to the workplace. Furthermore, companies should implement training and development programs, both internally and externally, for new hires and long-term employees alike, thereby empowering them to pursue career advancement and increase their earning potential. Additionally, optimizing work distribution is crucial to prevent employees from becoming overwhelmed with excessive overtime, ensuring they have ample time to engage with family, friends, and personal interests. In summary, companies have a range of effective strategies at their disposal to reduce employee turnover.
To predict employee turnover effectively, companies must maintain stable systems and processes for collecting relevant data. This data should remain free from ethical or legal implications that could create challenges for the organization; only under these conditions can we feasibly develop ML models. Furthermore, a thorough understanding of these models, including their functionality, strengths, and limitations concerning the database, is essential. This knowledge allows researchers to identify relevant variables and continuously monitor them alongside the model’s performance after deployment.
Future work will focus on enhancing the ANN algorithm, which has demonstrated the highest efficiency, with the objective of increasing the F1-score. In recent years, the proliferation of DL algorithms has led to the optimization and development of numerous libraries and procedures that can significantly improve the model’s performance. Furthermore, leveraging real-world databases that incorporate a diverse range of variable types will provide valuable insights into the model’s effectiveness. When working with these real databases, it is common practice to create new variables or indices that compile groups of related variables. The approach not only synthesizes information but also effectively reduces the overall number of variables.
CONFLICTS OF INTEREST
The author declares no conflicts of interest.
CREDIT AUTHOR STATEMENT
Marcos A. Albarracin Manrique: conceptualization, data curation, formal analysis, investigation, methodology, project administration, resources, supervision, validation, software, visualization, writing: original draft, and writing: review & editing.
REFERENCES
Adeyefa, A. E., Adedipe, A., Adebayo, I. N., & Adesuyan, A. J. (2023). Influence of green human resource management practices on employee retention in the hotel industry. African Journal of Hospitality, Tourism and Leisure, 12(1), 114-130. https://doi.org/10.46222/ajhtl.19770720.357
Al-Suraihi, W. A., Samikon, S. A., Al-Suraihi, Al-H. A., & Ibrahim, I. (2021). Employee turnover: Causes, importance and retention strategies. European Journal of Business Management and Research, 6(3), 1-10. https://doi.org/10.24018/ejbmr.2021.6.3.893
Albarracin Manrique, M. A. & Souza, F. (2021, October 6-7). Real Estate Price Valuation Using Machine Learning (in Portuguese). En The 20th Conferência Internacional da Latin American Real Estate Society (LARES). https://lares.architexturez.net/doc/lares-2021-4dqw
Almomani, A., Alauthman, M., Shatnawi, M. T., Alweshah, M., Alrosan, A., Alomoush, W., Gupta, B. B., Gupta, B. B., & Gupta, B. B. (2022). Phishing website detection with semantic features based on machine learning classifiers: A comparative study. International Journal on Semantic Web and Information Systems, 18(1), 1-24. https://doi.org/10.4018/IJSWIS.297032
Alsubaie, F. & Aldoukhi, M. (2024). Using machine learning algorithms with improved accuracy to analyze and predict employee attrition. Decision Science Letters, 13(1), 1-18. https://doi.org/10.5267/j.dsl.2023.12.006
An, S. H. (2019). Employee voluntary and involuntary turnover and organizational performance: Revisiting the hypothesis from classical public administration. International Public Management Journal, 22(3), 444-469. https://doi.org/10.1080/10967494.2018.1549629
Cloutier, O., Felusiak, L., Hill, C., & Pemberton-Jones, E. J. (2015). The importance of developing strategies for employee retention. Journal of Leadership, Accountability and Ethics, 12(2), 119-129. http://www.na-businesspress.com/JLAE/Pemberton-JonesEJ_Web12_2_.pdf
Dalton, D. R. & Mesch, D. J. (1990). The impact of flexible scheduling on employee attendance and turnover. Administrative Science Quarterly, 35(2), 370-387. https://doi.org/10.2307/2393395
Duda, J., & Žůrková, L. (2013). Costs of employee turnover. Acta Universitatis Agriculturae et Silviculturae Mendelianae Brunensis, 61(7), 2071-2075. https://doi.org/10.11118/actaun201361072071
Efron, B. & Hastie, T. (2016). Computer Age Statistical Inference Algorithms, Evidence, and Data Science. Cambridge University Press. https://www.cambridge.org/core/books/computer-age-statistical-inference/E32C1911ED937D75CE159BBD21684D37
El Maanaoui, D., Jeaab, K., Najmi, H., Saoudi, Y., & Falloul, M. E. M. (2024). Machine learning in finance: Case of credit scoring. In Y. Farhaoui, A. Hussain, T. Saba, H. Taherdoost, & A. Verma (Eds.), Artificial Intelligence, Data Science and Applications. ICAISE 2023 (Lecture Notes in Networks and Systems, 837, 8-16). Springer. https://doi.org/10.1007/978-3-031-48465-0_2
Fallucchi, F., Coladangelo, M., Giuliano, R., & William De Luca, E. (2020). Predicting employee attrition using machine learning techniques. Computers, 9(4), 86. https://doi.org/10.3390/computers9040086
Fernandes, S. L., & Sharma, T. K. (2022). Artificial intelligence in industrial applications: Approaches to solve the intrinsic industrial optimization problems (1st ed.). Springer International Publishing. https://doi.org/10.1007/978-3-030-85383-9
Gaurav, A., Gupta, B. B., & Panigrahi, P. K. (2023). A comprehensive survey on machine learning approaches for malware detection in IoT-based enterprise information system. Enterprise Information Systems, 17(3). https://doi.org/10.1080/17517575.2021.2023764
Géron, A. (2019). Hands-on machine learning with Scikit-Learn, Keras, and TensorFlow. O’Reilly Media.
Goodfellow, I., Bengio, Y., & Courville, A. (2016). Deep learning. MIT Press.
Gundlach, H. A. D. (2025). What really influences teacher attrition, migration, and retention? The Australian Educational Researcher, 52, 3079-3099. https://doi.org/10.1007/s13384-025-00842-4
Hastie, T., Tibshirani, R., & Friedman, J. (2009). The elements of statistical learning data minin`g, inference, and prediction (2nd ed). Springer. https://link.springer.com/book/10.1007/978-0-387-84858-7
Hur, H. & Abner, G. (2023). What makes public employees want to leave their job? A meta-analysis of turnover intention predictors among public sector employees. Public Administration Review, 84(1), 115-142. https://doi.org/10.1111/puar.13601
James, G., Witten, D., Hastie, T., Tibshirani, R. & Taylor J. (2023). An introduction to statistical learning with applications in Python. Springer.
Juvitayapun, T. (2021, Jan 21-24). Employee turnover prediction: The impact of employee event features on interpretable machine learning methods. In The 13th International Conference on Knowledge and Smart Technology (KST), 181-185. https://doi.org/10.1109/KST51265.2021.9415794
Kelleher, J. D. & Tierney, B. (2018). Data science. The MIT Press.
Kelleher, J. D. (2019). Deep learning. The MIT Press.
Kelleher, J. D., MacNamee, B., & D’Arcy, A. (2015). Fundamentals of machine learning for predictive data analytics: Algorithms, worked examples, and case studies. MIT Press.
Marsland, S. (2014). Machine learning: An algorithmic perspective (2nd ed.). Chapman and Hall/CRC. https://doi.org/10.1201/b17476
Murphy, K. P. (2022). Probabilistic Machine Learning: An introduction. MIT Press.
Murphy, K. P. (2023). Probabilistic Machine Learning: Advanced Topics. MIT Press.
Nagpal, P., Pawar, A., & Sanjay H. M. (2024, Feb 21-23). Predicting employee attrition through HR analytics: A machine learning approach. In The 4th International Conference on Innovative Practices in Technology and Management (ICIPTM). 1-4. https://doi.org/10.1109/ICIPTM59628.2024.10563285
Park, J., Feng, Y., & Jeong, S. P. (2024). Developing an advanced prediction model for new employee turnover intention utilizing machine learning techniques. Scientific Reports, 14, 1221. https://doi.org/10.1038/s41598-023-50593-4
Pedregosa, F., Varoquaux, G., Gramfort, A., Michel, V., Thirion, B., Grisel, O., Blondel, M., Prettenhofer, P., Weiss, R., Dubourg, V., Vanderplas, J., Passos, A., & Cournapeau, D. (2011). Scikit-learn: Machine learning in Python. Journal of Machine Learning Research, 12, 2825-2830. https://inria.hal.science/hal-00650905v2
Pelly, D. (2023). Worker well-being and quit intentions: Is measuring job satisfaction enough? Social Indicators Research, 169, 397-441. https://doi.org/10.1007/s11205-023-03166-x
Prokopets, E. (2024). The true cost of hiring an employee in 2024 [blog entry]. Toggl. https://toggl.com/blog/cost-of-hiring-an-employee
Ribes, E., Touahri, K., & Perthame, B. (2017). Employee turnover prediction and retention policies design: a case study. Computers and Society. https://doi.org/10.48550/arXiv.1707.01377
Rombaut, E, & Guerry, M. A. (2018). Predicting voluntary turnover through human resources database analysis. Management Research Review, 41(1), 96-112. https://doi.org/10.1108/MRR-04-2017-0098
Russell, S. J., & Norvig, P. (2021). Artificial intelligence: A modern approach. Pearson.
Sadiku, M., Ashaolu, T. J., Ajayi-Majebi, A., & Musa, S. (2021). Artificial intelligence in social media. International Journal of Scientific Advances, 2(1), 15-20. https://doi.org/10.51542/IJSCIA.V2I1.4
Saradhi, V. V., & Palshikar, G. K. (2011). Employee churn prediction. Expert Systems with Applications, 38(3), 1999-2006. https://doi.org/10.1016/j.eswa.2010.07.134
Sharma, S. & Sharma, K. (2023, June 23-25). Analyzing Employee’s Attrition and Turnover at Organization Using Machine Learning Technique. In The 3rd International Conference on Intelligent Technologies (CONIT). 1-7. https://doi.org/10.1109/CONIT59222.2023.10205676
Solomon, C. H., Mohankumar D. & Sivanandam, C. (2024, Feb 22-23). Employee attrition analysis using machine learning. In The 2nd International Conference on Emerging Trends in Information Technology and Engineering (ICETITE). https://doi.org/10.1109/ic-ETITE58242.2024.10493429
Soltaninejad, M., Aghazadeh, R., Shaghaghi, S., & Zarei, M. (2024). Using machine learning techniques to forecast Mehram company’s sales: A case study. Journal of Business and Management Studies, 6(2), 42-53. https://doi.org/10.32996/jbms.2024.6.2.4Subhash, P. (2017). IBM HR analytics employee attrition & performance. Kaggle. https://www.kaggle.com/pavansubhasht/ibm-hr-analytics-attrition-dataset
Tuzun, I. K. & Kalemci, R. A. (2012). Organizational and supervisory support in relation to employee turnover intentions. Journal of Managerial Psychology, 27(5), 518-534. https://doi.org/10.1108/02683941211235418
Vasantham, S. T. & Aithal, S. (2022). A systematic review on importance of employee turnover with special reference to turnover strategies. Irish Interdisciplinary Journal of Science & Research, 6(4), 28-42. https://doi.org/10.46759/iijsr.2022.6404
Veglio, V., Romanello, R., & Pedersen, T. (2024). Employee turnover in multinational corporations: a supervised machine learning approach. Review of Managerial Science, 19, 687-728. https://doi.org/10.1007/s11846-024-00769-7
Wang, W. & Sun, R. (2020). Does organizational performance affect employee turnover? A re-examination of the turnover-performance relationship. Public Administration, 98(1), 210-225. https://doi.org/10.1111/padm.12648
Wassan, S., Suhail, B., Mubeen, R., Raj, B., Agarwal, U., Khatri, E., Gopinathan, S., & Dhiman, G. (2022). Gradient boosting for health IoT federated learning. Sustainability, 14(24), 16842. https://doi.org/10.3390/su142416842