Proposal for Improving Inventory Replenishment through Lean Tools in a Peruvian Retail Company
Renato André Lino Robles*
https://orcid.org/0000-0003-0121-8266
Universidad de Lima, Facultad de Ingeniería, Lima, Perú
Marysell Jiménez Loaiza
https://orcid.org/0000-0001-8885-2950
Universidad de Lima, Facultad de Ingeniería, Lima, Perú
Received: October 10th, 2023 / Accepted: October 20th, 2023
ABSTRACT. This research work aims to improve inventory replenishment in a retail company as it is essential for any company to meet product demand. Therefore, by analyzing the percentage of canceled orders within the retail company and using an Ishikawa diagram, it was determined that the absence of distribution centers led to cost overruns in the logistics process. By employing this methodology, the improvement proposal was divided into three stages: logistics hubs information collection and diagnosis; design and validation of the improvement proposal; and evaluation of the improvement proposal viability, risks and implementation time. These stages indicate that the proposed solution would involve establishing a logistics hub to serve as a low-cost distribution warehouse. Furthermore, during this research, we used the 5S methodology, one of the most popular lean tools, applicable to every department and action. Based on the analysis of the cost flow and economic scenarios, it is concluded that implementing the hub is feasible. This would not only increase product availability and assortment but also result in savings on transportation costs from the distribution center in Lima to the hub located in Tarapoto, Peru.
KEYWORDS: commercial distribution / inventory control / business logistics / lean manufacturing / warehouses / Peru
This study was not funded by any entity.
* Corresponding author.
Email addresses in order of appearance: [email protected]; [email protected]
This is an open access article, distributed under the terms of Creative Commons Attribution 4.0 International (CC BY 4.0) license.
PROPUESTA PARA LA MEJORA EN LA REPOSICIÓN DE INVENTARIO EN UNA EMPRESA RETAIL PERUANA MEDIANTE HERRAMIENTAS LEAN
RESUMEN. La reposición de inventario es fundamental en toda empresa retail para poder satisfacer la demanda del producto. Es por ello que mediante el porcentaje de pedidos cancelados en la empresa retail y un diagrama de Ishikawa se determinó que el problema se encontraba en que no contaban con centros de distribución por lo que el proceso logístico producía sobrecostos, mediante la metodología aplicada la propuesta de mejora se divide en tres etapas, las cuales consisten en la recolección de información y diagnóstico de Hubs logísticos, el diseño y validación de la propuesta de mejora y por último la viabilidad, riesgos y tiempos que tomarían ejecutar la propuesta, estas etapas determinan que la solución a tomar seria colocar un Hub logístico que apoyaría con la distribución como almacén de bajo costo. Se concluye que es viable implementar el centro de operaciones, lo cual incrementaría la disponibilidad de mercadería, al igual que el surtido y se ahorraría en transporte del centro de distribución de lima al Hub ubicado en Tarapoto.
PALABRAS CLAVE: distribución comercial / gestión de stocks / logística empresarial / producción eficiente / almacenes / Perú
Inventory replenishment ensures that a company responds quickly to customer needs, thus achieving a proper balance between product outputs (sales) and inputs (purchases). Effective inventory management offers benefits not only in terms of sales but also when it comes to responding to customer portfolio requests. While it is true that all companies depend on their inventory, there are some sectors in which this aspect is essential to remain competitive. One of those sectors is retail.
Retail is an economic sector that includes companies specialized in the mass marketing of products. Companies in this sector seek to reach the largest number of consumers through a massive stock of products, which is why their inventory replenishment policy is critical to meet the needs of their customers. According to Praveen et al. (2020), the key tasks of a retail business are: determine the needs of its customers and guide the company towards satisfying all their needs. During recent years, increased competition in retail sector has led to new cooperative arrangements between third-party logistics providers in the form of hub systems. Logistics hubs are large-scale structures within which different logistics service providers collaborate in order to offer value-added services by sharing assets (Viera & Luna, 2016).
Recognizing today’s endless globalization and internalization, companies are required to improve their logistic capacity. The developments and advancements in logistics sector have facilitated major business functions such as production, distribution, and marketing. This provides a significant competitive advantage in international trade transactions. It is argued that effective and accurate planning of logistics sector is able to contribute to the economic growth of a nation. (Engman, 2005, as cited in Mohsin & Daud, 2018, pp. 141–142)
At the regional level, the Global Retail Development Index (GRDI) placed Peru in a list of the 30 most attractive emerging countries to invest in the retail sector. Most consultants consider Peru very attractive for this sector due to its sustained economic growth over the past two decades (Reátegui et al., 2017). In addition, it is one of the sectors that has shown the strongest recovery from the drop in sales caused by the pandemic. This is largely due to the eation of digitization strategies and adequate replacement policies, ensuring their coverage for their entire target audience.
The company under study specializes in the marketing of appliances and household items. With operations in several countries, including Peru, it has successfully positioned as one of the leaders in distribution and logistics. During the last years, it has implemented a very powerful web platform that allows people from all over the country to buy products through the website and pick them up in store or receive them at home. However, since the implementation of this platform, the company has experienced prolonged delays in shipping products to the Amazonian Region. Moreover, direct shipments from the distribution center to this area resulted in cost overruns that did not guarantee the long-term economic viability of forest operations. Below are the historical percentages of orders canceled in the Amazonian Region of the country.
Figure 1
Percentages of Canceled Orders

As shown in Figure 1, there was a significant increase between 2020 and 2021; the main reason was the implementation of a web platform, resulting in a higher volume of order requests across the national territory. Thus, throughout 2021, the company experienced a 19,30 % rise in the number of canceled orders, totaling 1 200 orders in the Amazonian Region alone. The predominant reason for this percentage was delays in orders fulfillment, surpassing the company’s established policy.
The cities with the highest number of canceled orders were Juanjuí, Moyobamba, Pichanaqui, Yurimaguas and Tarapoto. One of the reasons for the delay in fulfilling orders is the limited presence of own distribution centers near these locations. Therefore, the company seeks alternatives to improve said situation. To achieve this objective, the present project proposes the establishment of a logistics hub in such a way to enhance the efficiency of order delivery to the Amazonian Region, which currently experiences the most significant delays; i.e., the project aims to optimize transportation, sorting, delivery and distribution processes in the Peruvian jungle.
The current supply frequency for cities such as Juanjuí and Yurimaguas is approximately once per week, while for Moyobamba and Tarapoto, it is twice a week. Also, as ofe % of the total sales of stores that would be supplied by the implemented hub. In terms of costs, Region 6 (jungle) allocates USD 1e500 per month to cover redistribution expenses for sales in cities like Tarapoto, Juanjuí, Moyobamba and Yurimaguas.
Ishikawa Diagram of High Percentage of Cancelled Orders in the Amazonian Region
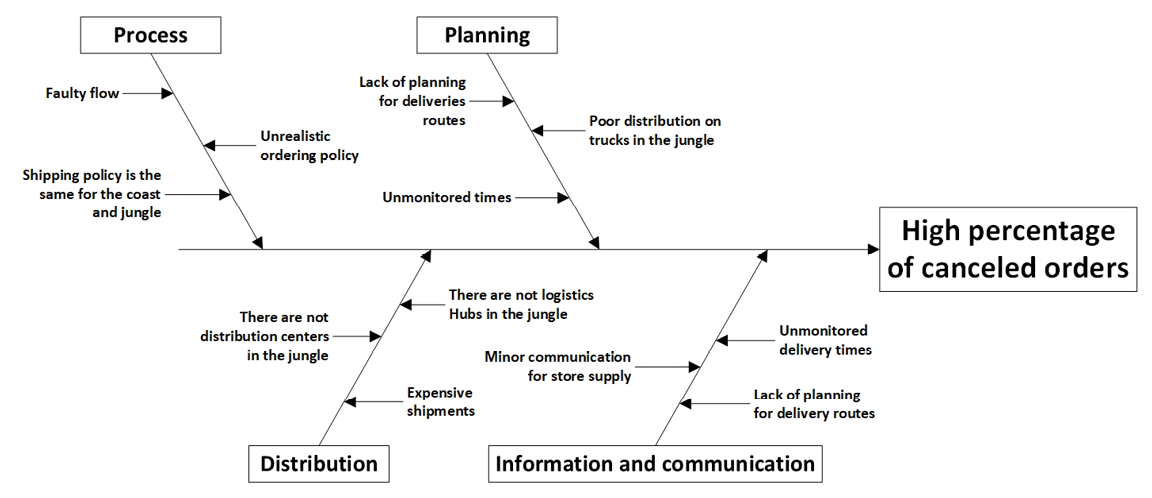
As shown in Figure 2, the problem of order cancellations is directly linked to the scarcity of warehouses in the jungle area and the unstocked stores within that region. It is also important to note that there are other significant issues such as inadequate route planning for order delivery, lack of information for order tracking, etc. However, a project to implement new delivery routes across the country would be very expensive; therefore, the most viable solution to solve order-related problems in the medium term is the establishment of a distribution center in the Amazonian Region.
The sales performance of the company under study is currently not at its peak. Moreover, the recent investment in the web platform required a significant capital outlay, leading to the implementation of budget reduction policies across different areas such as Planning, Supply Chain, etc. Consequently, in economic terms, establishing a distribution center in the jungle would entail a substantial financial investment since it involves the acquisition of large premises, allocation of inventory, purchase of additional trucks, etc. Therefore, a more feasible solution would be the implementation of a logistics hub, as it is a cheaper option and does not involve such a radical logistical change. According to Cheong et al. (2007), hubs serve as transshipment facilities that allow the construction of a network where large numbers of direct connections between nodes (including suppliers, warehouses and customer locations) can be replaced with fewer, indirect connections. In solving hub location problems, two distinct aspects need to be addressed: finding the best locations for the hubs and identifying the best route for material flows from the origin nodes to the destination nodes via the hubs. One of the pioneering studies in hub location was conducted by O’Kelly et al. (1986), who demonstrated that the single hub location problem is equivalent to the Weber’s least cost theory: to establish a small distribution center that constantly supplies nearby stores and handles home orders.
Warehouse optimization: Identifying gaps in the location of some hubs is essential to address key issues such as the modeling of economies of scale while using the most complex times and objectives as resources. There are many strategies for warehouse improvement and expansion, including the 5S methodology and ABC classification.
Hubs have been implemented in small- and medium-sized businesses (PYMEs) considering various factors, including demand, as reflected by consumption points, evaluation of distribution channels, product standardization and the sales record of the companies (Escalona & Ramos, 2015).
The implementation of the 5S methodology directly impacts service quality. According to the analysis carried out in this research, it can be determined that the 5S correlates stronglyewith service failures and quality, which allows its effectiveness in the study. This analysis involved 200 consumers—though only 150 responded to the survey—verifying the reliability of the 5S methodology. Additionally, this methodology has been used in retail companies for approximately 30 years. Moreover, the implementation of lean tools has shown positive results in terms of profitability (Davatgaran et al., 2019).
The 5S methodology is a tool focused on organization and contributes to a reduction in rework time (Yu et al., 2017). For example, implementing 5S in a franchise in Bandung resulted in a 71-second reduction in inspection time. Furthermore, once the problems were identified, strategies could be developed, leading to a decrease in the number of accidents to two per year. Management indicators are employed to assess the performance of several logistics processes in order to reduce errors and find solutions. One approach involves proposing a set of tools such as direct observation and cause-and-effect diagrams to understand and identify deficiencies in a company’s distribution chain.
At the same time, the interrelationship between products, materials, components and final products can be demonstrated. It has been determined that external communication and productivity offset manufacturing costs. Implementing the 5S methodology can help reduce production losses. According to Reina and Adarme (2014), distribution is the most important step in a logistic process flow. Therefore, all production must be scheduled based on consumer demand and the availability of materials in stock.
It also highlights that inventory optimization is often a complex process where the organization accepts some unknown damages during implementation; however, by means of a suitable simulation model, damages can be mitigated to the greatest extent possible.
The process begins with the development of a conceptual scheme of the model. Basically, at this stage, it is sought to represent the process in a general manner within a scheme. Then, the system and its correct functioning are verified using various tools. At this point, the conceptual model becomes a statistical, mathematical or graphical structure. Finally, the system is validated as a final output. This involves validating the performance of the simulation using outputs. It can be demonstrated through any simulation that the proposed inventory management will lead to a better control of the merchandise, thereby optimizing storage costs (Oldham & Fornito, 2019).
It has been proven that simulating demand beforehand helps small- and medium-sized businesses to maintain optimal inventory levels eemploying forecasting techniques in this simulation aids to reduce overstock by facilitating better product allocation (Holweg et al., 2005).
In summary, in scenarios where the dataset is small and well-structured, algorithms based on decision trees demonstrate superior accuracy compared to other models. Theoretically, the XGBoost algorithm evolved from the Bagging algorithm.
2. METHODOLOGY
The methodological design of this research involves a case study wherein a new strategy was proposed to enhance order delivery and store supply in the Amazonian Region of Peru. According to Andersson et al. (2010), supply chain management entails a set of approaches used to effectively integrate suppliers, manufacturers, warehouses and stores, so that merchandise is produced and distributed at the right quantities. In the proposed improvement, the projection of flows based on the sales history was developed, and the required jungle space in cubic meters for merchandise was taken into account to determine the size of the logistics hub. In addition, the input of three logistics experts in the retail sector, who served as manager of supply chain and planning and replenishment analysts in a Peruvian retail company, was crucial for validating the reliability of flows, projections and scenarios. It should be noted that these professionals have extensive knowledge in hub implementation since they have participated in similar projects in other regions of Peru, such as Ica and Cusco.
The methodological process of the research was structured in three consecutive stages, each of which will apply engineering techniques crucial for the reliability of the improvement proposal:
Stages of the Improvement Proposal
|
Stage |
Scope |
Techniques and/or Tools |
|
1. Information collection and diagnosis |
Collection of information on hub location alternatives |
Documentary analysis |
|
Cost estimation for each location |
Demand projection |
|
|
2. Design and validation of the improvement proposal |
Elaboration of the hub |
Three scenarios for operational utility |
|
Establishing a preliminary route following the implementation of the hub |
||
|
3. Evaluation of the improvement proposal viability, risks and implementation time |
Elaboration of the project schedule and risk matrix |
Irrigation matrix |
|
Preparation of conclusions on project feasibility |
Gantt chart |
In the first stage, all necessary information was collected to complete the flow projections, i.e., rental costs of potential locations, labor costs in the city, security costs, maintenance expenses, sales data of previous years, past order volumes and inventory replenishment policies. It should be noted that this information was sourced from the historical flows of the company under study. The reliability of the data was validated by comparing it with the company’s historical records.
In the second stage, all the information collected in the previous stage was used to develop the project cost flow with a horizon of no less than four years. Additionally, the economic projection was made based on three specific scenarios: optimistic, expected and pessimistic. These projections allowed for an initial assessment of the project’s economic viability, considering factors such as time, costs, etc. The validation of results in this stage was conducted within the margins provided by experts, based on the projected sales.
Finally, in the third stage, a risk matrix was proposed for the project. This matrix served as a management tool to objectively identify relevant risks to the safety and health of workers throughout the hub implementation. Furthermore, a detailed contingency plan was outlined for each identified risk. In addition, a Gantt chart was created to visualize the project’s key components and organize them into smaller and manageable tasks.
3. RESULTS
The results obtained from each stage of the improvement proposal are presented below, as detailed in the methodology.
According to the analysis, the first stage involving information collection and diagnosis was assessed. This stage determined that the required capacity for the Tarapoto Hub is 1 000 m3, Pichanaqui requires 700 m3 and Yurimaguas needs 400 m3, according to the average sales volume in m3 for the year 2021 (considering peak periods such as Mother’s Day and national holidays).
The following table presents the number of stores and the capacity needed for each location.
Table 2
Capacity Needed and Number of Stores
|
Capacity Needed (m3) |
Number of Stores |
|
|
Tarapoto |
1 000 |
2 |
|
Yurimaguas |
400 |
2 |
|
Pichanaqui |
100 |
1 |
|
Moyobamba |
100 |
1 |
Based on data obtained from the cities, Tarapoto shows the highest demand for merchandise based on the historical trends in the Amazonian Region. Therefore, it is prioritized for the establishment of a new route and rental hub in that area.
The current total frequency is outlined below with the proposed frequency obtained from the needed capacity calculations:
Table 3
Summary of Tarapoto Route
|
Shop |
Current |
Proposed Frequency With Improvement |
m3 x |
Proposed |
Products m3 |
|
e |
2 |
4 |
13 |
Tarapoto Ciudad |
53 |
|
e |
2 |
4 |
12 |
Tarapoto Ciudad |
41 |
In the second stage, the design and validation of the improvement proposal were undertaken. With the introduction of this new route, the stores intended to supply the Tarapoto Hub consisted of two direct stores and 11 per route, all of which are currently serviced from the distribution center in Lima. This rerouting aims to mitigate cost overruns.
The total route was 517 km and the approximate travel time accounted for 9 hours and 46 minutes. Additionally, the costs of implementing the Tarapoto Hub were calculated, followed by the projection of flows over a four-year period:
Table 4
Tarapoto Hub Implementation Costs (USD)
|
Reduction of alternate warehouses |
-5 206 |
|
Regional office savings |
-1 320 |
|
Current freight route through the jungle |
-12 446 |
|
New fethe distribution center to the hub |
10 825 |
|
New hub freight to stores |
5 684 |
|
New security |
1 600 |
|
New payroll |
1 540 |
|
e |
3 160 |
|
New investment racks |
6 900 |
In Table 3, the costs of the project are outlined, and it is evident that significant savings would result from the project. Through the reduction of alternate warehouses and current freight alone, the company would achieve savings of more than USD 18 000.
Logistics Hub Flow Costs (USD)
|
Total Month |
Total Cost Year 1 |
Total Cost Year 2 |
Total Cost Year 3 |
|
-5206 |
-62 476 |
-62 476 |
-62 476 |
|
-1316 |
-15 789 |
-15 789 |
-15 789 |
|
-12 447 |
-149 363 |
-149 363 |
-149 363 |
|
10 823 |
1 298 802 |
1 298 802 |
1 298 802 |
|
5684 |
68 211 |
68 211 |
68 211 |
|
1605 |
19 263 |
19 263 |
19 263 |
|
1533 |
18 392 |
18 392 |
18 392 |
|
3158 |
37 895 |
37 895 |
37 895 |
|
551 |
6612 |
6612 |
6612 |
|
4386 |
51 625 |
51 625 |
51 625 |
|
Annual Margin Income |
Income Year 1 |
Income Year 2 |
Income Year 3 |
|
407 953 |
4 895 442 |
5 140 214 |
5 384 987 |
|
373 957 |
4 487 489 |
4 711 863 |
4 936 238 |
|
356 959 |
4 283 512 |
4 497 688 |
4 711 863 |
|
Total Cost Year 1 |
Total Cost Year 2 |
Total Cost Year 3 |
|
|
52 625 |
52 625 |
52 625 |
Based on the costs of the logistics hub and sales projections, a reliable flow was established, summarizing the totals over a four-year period. Additionally, three operational utility scenarios were developed based on this flow, considering that the costs of implementing the Tarapoto Hub would remain constant over the next four years. For the optimistic, conservative and pessimistic scenarios, an annual margin income of 100 %, 91,6 % and 87,5 %, respectively, were considered.
Table 6
Tarapoto Hub Implementation Costs (USD)
|
Year 1 |
Year 2 |
Year 3 |
Year 4 |
|
|
Optimistic Operating Profit |
4 842 817 |
5 087 589 |
5 332 362 |
5 577 134 |
|
Conservative Operating Profit |
4 434 864 |
4 659 238 |
4 883 613 |
5 107 987 |
|
Pessimistic Operating Profit |
4 230 887 |
4 445 063 |
4 659 238 |
4 873 414 |
According to the third stage, the improvement proposal viability, risk and implementation time were evaluated. Initially, the risk matrix and contingency plan, fundamental for any implementation project, are presented.
Table 7
Risk Matrix
|
# |
Risk |
Rationale |
Contingency Plan |
|
1 |
Failures in the assembly of the racks. |
The purchased racks may have quality issues that prevent them from being assembled correctly. |
Ensure timely delivery of the racks to allow for a preliminary quality control. |
|
2 |
Delays in recruitment. |
It is possible that, within the allotted timeframe, suitable candidates may not be found to fill the positions. |
Outsource the security service to an agency and temporarily fill hub staff positions with certified workers from nearby stores. |
|
3 |
Failure to find a rental location within budget. |
Given that the premises must be located in a specific area, it is possible that a suitable location may not be found at the |
Allocate a contingency reserve to accommodate potential budget increases if a location at the desired price is not found. |
|
4 |
Delay in hub delivery. |
Due to the aforementioned risks, the completion of the hub’s construction could be delayed beyond the original schedule. |
Manage the arrival of new merchandise within one month after the hub’s delivery. |
4. DISCUSSION
According to Lolli et al. (2017), the need of potential locations for the implementation of distribution centers should be prioritized. Through the analysis carried out in this research, it was determined that the merchandise requirement for the Tarapoto Hub was 1 000 m3. Consequently, Tarapoto was selected as the ideal location for implementing the logistics hub based on two key factors: the stores that will supply along the route and the weekly replenishment frequency.
According to Osorio (2008), the conservative or most likely scenario is the one with the highest probability of occurrence. Hypotheses are formulated to adjust net cash flows based on expected long-term outcomes. Based on the study conducted and the sales increase across the three scenarios, the viability of implementing the logistics hub can be deduced. Even in a conservative scenario, there is an 11 % sales increase. In the worst-case scenario, the project remains viable with a 5 % sales increase. In addition, the project will enhance merchandise availability for both in-store sales and e-commerce deliveries, as stores will be better stocked and benefit with a new route to reduce delivery times.
According to Inprasit and Tanachutiwat (2018), it is crucial, during project schedule planning, to eliminate early starts and multitasking in order to enhance project activity speed and efficiency.
In this research, the main tasks were prioritized based on their duration in days (main criterion), with multitasking minimized accordingly.
5. CONCLUSIONS
The implementation of the hub remains feasible even under a pessimistic scenario, which results in a 5 % sales increase. Additionally, it will enhance merchandise availability ein-e-commerce deliveries, as stores will be better stocked and benefit from a new route to reduce delivery times. Furthermore, the stores will no longer face bankruptcy due to inventory shortages, as the logistics hub will increase delivery frequency from 2 to 4 times per week. On the other hand, the breakdown of assortment for stores supplied from the region will progressively decrease from 15 % to 5 % over the four-year implementation period. Finally, with a daily supply to the hub, supplier shipments will go directly to it, eliminating the need for transport from the distribution center in Lima to the Tarapoto Hub.
6. REFERENCES
Andersson, H., Hoff, A., Christiansen, M., Hasle, G., & Løkketangen, A. (2010). Industrial aspects and literature survey: Combined inventory management and routing. Computers & Operations Research, 37(9), 1515–1536. https://doi.org/10.1016/j.cor.2009.11.009
Cheong, M., Bhatnagar, R., & Graves, S. C. (2007). Logistics network design with supplier consolidation hubs and multiple shipment options. Journal of Industrial and Management Optimization, 3(1), 51–69. https://ink.library.smu.edu.sg/cgi/viewcontent.cgi?article=3448&context=sis_research
Davatgaran, V., Saniei, M., & Mortazavi, S. S. (2019). Smart distribution system management considering electrical and thermal demand response of energy hubs. Energy, 169, 38–49. https://doi.org/10.1016/j.energy.2018.12.005
Escalona, A. I., & Ramos, D. (2014). Global production chains in the fast fashion sector, transports and logistics: the case of the Spanish retailer Inditex. Investigaciones Geográficas, Boletín del Instituto de Geografía, (85), 113–127. https://doi.org/10.14350/rig.40002
Holweg, M., Disney, S., Holmström, J., & Småros, J. (2005). Supply chain collaboration: Making sense of the strategy continuum. European Management Journal, 23(2), 170–181. https://doi.org/10.1016/j.emj.2005.02.008
Inprasit, T., & Tanachutiwat, S. (4-7 de julio de 2018). Reordering point determination using machine learning technique for inventory management [Sesión de conferencia]. 2018 International Conference on Engineering, Applied Sciences, and Technology (ICEAST). Phuket, Thailand. https://doi.org/10.1109/ICEAST.2018.8434473
Lolli, F., Gamberini, R., Regattieri, A., Balugani, E., Gatos, T., & Gucci, S. (2017). Single-hidden layer neural networks for forecasting intermittent demand. International Journal of Production Economics, 183, 116–128. https://doi.org/10.1016/j.ijpe.2016.10.021
Mohsin, A., & Daud, D. (2018). Oman as a future logistics hub: A conceptual study. International Journal of Economics, Commerce and Management, 6(6), 141–148. https://ijecm.co.uk/wp-content/uploads/2018/06/6610.pdf
O’Kelly, M. E., Bryan, D., Skorin-Kapov, D., & Skorin-Kapov, J. (1996). Hub network design with single and multiple allocation: A computational study. Location Science, 4(3), 125–138. https://doi.org/10.1016/S0966-8349(96)00015-0
Oldham, S., & Fornito, A. (2019). The development of brain network hubs. Developmental Cognitive Neuroscience, 36, 1-14. https://doi.org/10.1016/j.dcn.2018.12.005
Osorio, C. (2008). Modelos para el control de inventarios en las pymes. Panorama, 2(6), 4–10. https://doi.org/10.15765/pnrm.v2i6.241
Praveen, K. B., Kumar, P., Prateek, J., Pragathi, G., & Madhuri, J. (2020). Inventory management using machine learning. International Journal of Engineering Research & Technology (IJERT), 9(6), 866–869. https://www.ijert.org/research/inventory-management-using-machine-learning-IJERTV9IS060661.pdf
Reátegui, D., Castro, P., & Ramírez, J. (2017). Implementación de un hub logístico de repuestos Honda en Latinoamérica [Final project, Universidad Peruana de Ciencias Aplicadas]. Repositorio Académico UPC. http://hdl.handle.net/10757/311183
Reina, L., & Adarme, W. (2014). Logística de distribución de productos perecederos: estudios de caso Fuente de Oro (Meta) y Viotá (Cundinamarca). Revista Colombiana de Ciencias Hortícolas, 8(1), 80–91. https://doi.org/10.17584/rcch.2014v8i1.2802
Vieira, C., & Luna, M. (2016). Models and methods for logistics hub location: A review towards transportation networks design. Pesquisa Operacional, 36(2), 375–397. https://doi.org/10.1590/0101-7438.2016.036.02.0375
Yu, Y., Wang, X., Zhong, R. Y., & Huang, G. Q. (2017). E-commerce logistics in supply chain management: Implementations and future perspective in furniture industry. Industrial Management & Data Systems, 117(10), 2263–2286. https://doi.org/10.1108/IMDS-09-2016-0398