Multiplicity of Artificial Intelligence
Models for Bias Control
Juan R. Jaramillo 
Associate Professor with the Department of Innovation and Entrepreneurship,
Long Island University, New York, USA
Received: August 14, 2025 / Published: October 25, 2025 / Published: 5 June, 2026
doi: https://doi.org/10.26439/ciii2025.8662
- Introduction
The so-called Rashomon effect is inspired by Akira Kurosawa’s film Rashomon. In the film, four witnesses present different and contradictory accounts of the same crime. A similar situation is observed when multiple artificial intelligence (AI) and machine learning (ML) models generate solutions that achieve the same level of performance yet differ from one another when applied to the same dataset. More precisely, the so-called Rashomon effect [1] refers to the existence of multiple models with similar performance. These models may generate different and even contradictory predictions at the individual level [2]. In other words, two models with the same predictive capability may produce different predictions for certain observations. For example, consider a situation in which the objective is to predict loan defaults for 100 bank clients. A bank analyst developed two different models with an accuracy of 99%. In this case, one model misclassifies Pedro, whereas the second model misclassifies María.
In many cases, these differences could be associated with biases that are difficult to identify, leading to models that may favor or negatively affect certain groups. The Rashomon effect, also known as multiplicity, provides an opportunity to explore alternative models in order to identify those with acceptable predictability and greater robustness. Understanding these biases allows the development of more socially fair and responsible AI systems.
The origins of multiplicity are inherent in the generation and training processes of AI and ML models. The following section briefly discusses these causes.
- Origins of Multiplicity
The main sources of multiplicity include the preselected feature set, the optimization function, the geometry of the loss function, random data partitioning, random parameters initialization, and the hyperparameter tuning.
A. Variable Selection
In the early stages of data analysis, highly correlated variables are often removed. Methods such as Lasso regression reduce parameter dimensionality and computational burden. Although the resulting models may exhibit similar accuracy, they differ and may produce conflicting predictions for similar datasets.
B. Optimization Function and Geometry
The loss function used in the training process influences the structure of the final model. For example, minimizing the sum of squared errors and minimizing absolute errors would result in different models. Additionally, complex loss functions with multiple local optima may produce distinct models. Notably, gradient descent, which is commonly used for training, does not guarantee a global optimum. For complex models, obtaining a true global optimum may be computationally infeasible.
C. Data Partitioning
Splitting data into training, evaluation, and validation sets introduces variability. For example, an 85%/10%/5% split may produce models with greater similarity but increases the risk of overfitting compared with a 70%/20%/10% split. Random partitioning itself can produce models using similar performance metrics (e.g., R²) but slightly different predictive behaviors.
D. Random Initialization
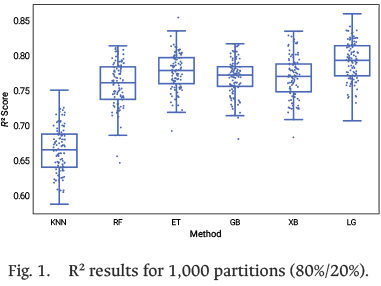
Many algorithms begin with random parameter initialization (e.g., regression coefficients or neural network weights). When the objective function contains multiple local optima or flat regions, parameter initial values influence the resulting best model. For example, neural networks may produce models with different parameters that yield similar performance on training data but could diverge on unseen data. Fig. 1 shows multiple models obtained with different ML techniques. For each technique 1,000 different 80/20 partitions were used. The chart illustrates the variability of R2 values represented by box plots.
E. Hyperparameter Tuning
Hyperparameters such as learning rate, number of iterations, tree depth, and number of trees (in ensemble methods) can produce models with similar aggregate performance but differing at the individual prediction level.
- Metrics to Measure Multiplicity
The first step in evaluating multiplicity is to identify the set of models with acceptable predictive performance [3], [4]. This set is known as the Rashomon set (1):
 (1)
(1)
where L(m) represents the loss function, m* denotes the best-performing model, and (ε) is the maximum acceptable deviation from the best model.
Other metrics are defined as follows:
- Rashomon ratio: The percentage of models in the Rashomon set relative to the total number of models considered. In practice, the number of possible models is computationally intractable.
- Capacity: The histogram of final error values across models belonging to the Rashomon set.
- In the case of classification problems, some metrics include the following:
- Ambiguity: The percentage of observations that receive conflicting predictions across models in the Rashomon set.
- Discrepancy: The percentage of observations with different predictions between two specific models.Similarly, for regression problems two metrics are defined as follows:
- Mean prediction error across models in the Rashomon set.
- Standard deviation of prediction errors.
- Implications
Multiplicity enables a deeper evaluation beyond selecting the model with minimal error. The Rashomon set allows comparison across models with similar predictive performance but potentially differing fairness characteristics.
For example, a résumé-screening model trained on historical hiring data may favor graduates from one university over another. Within the Rashomon set, alternative models with similar predictive power may reduce such disparities. Incorporating secondary fairness metrics can help identify models with lower bias while maintaining predictive performance.
- Conclusion
In industry practice, selecting the single best-performing model often ignores the existence of equally predictive alternatives. Analysts frequently underestimate the variability introduced by data selection and algorithmic approximation.
Multiplicity allows identification of more robust models, sometimes with improved social impact and only marginal reductions in predictive accuracy. Therefore, generating Rashomon sets and incorporating secondary evaluation metrics are recommended to ensure robustness and positive societal impact.
References
[1] L. Breiman, “Statistical modeling: The two cultures,” Stat. Sci., vol. 16, no. 3, pp. 199–215, Aug. 2001, doi: 10.1214/ss/1009213726
[2] C. Rudin et al., “Amazing things come from having many good models,” 2025, arXiv:2407.04846.
[3] L. Semenova, C. Rudin, and R. Parr, “On the existence of simpler machine learning models,” in Proc. ACM Conf. Fairness, Accountability, and Transparency (FAccT ’22), Seoul, Republic of Korea, 2022, pp. 1827–1858, doi: 10.1145/3531146.3533232.
[4] Fisher, C. Rudin, and F. Dominici, “All models are wrong, but many are useful: Learning a variable’s importance by studying an entire class of prediction models simultaneously,” J. Mach. Learn. Res., vol. 20, no. 177, pp. 1–81, Jan. 2019. [Online]. Available: https://jmlr.csail.mit.edu/papers/volume20/18-760/18-760.pdf