Integrated Application of MRP, ABC,
and SLP to Reduce Internal Supply Time
for Pinch Valve Production in a Peruvian
Metalworking Company
Jhoanna M. Alcantara Ramos1 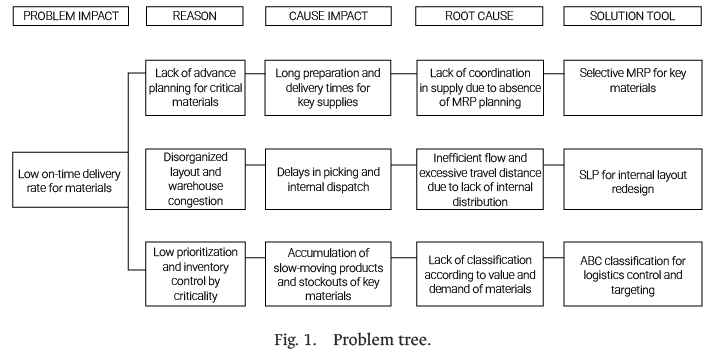 , Gianella Montenegro Espinoza2 , Edilberto Avalos-Ortecho3 ,
Silvia P. Ponce Alvarez4
1[email protected], 2[email protected], 3[email protected], 4[email protected]
1234Carrera de Ingeniería Industrial, Universidad de Lima, Perú
Received: August 12, 2025 / Accepted: September 19, 2025 / Published: 5 June, 2026
doi: https://doi.org/10.26439/ciii2025.8651
ABSTRACT—This study improves the internal supply of critical materials for pinch valve production in a Peruvian metalworking firm by applying Material Requirements Planning (MRP), ABC classification, and Systematic Layout Planning (SLP) to reduce lead times and enhance inventory flow. A representative sample from key warehouses was analyzed. AS-IS and TO-BE scenarios were simulated in Arena (62 replications) evaluating picking time, logistics lead time, and fulfillment rate. Results show a 10% drop in picking time and a more than 23% rise in fulfillment, confirming the combined tools’ effectiveness. The scalable methodology offers benefits for similar production lines.
Index Terms—ABC analysis, industrial engineering, internal supply, logistics, MRP, simulation, SLP.
- Introduction
The peruvian metalworking sector plays a key role in mining, construction, and energy, contributing 12.5% of manufacturing GDP (S/ 71,700 million in 2021). Within this sector, the fabricated metal products subsector accounted for 11.2% of gross industrial value added [1]. However, operational gaps persist as the Perfect Order Fulfillment rate stands at 76.21%, below the optimal 80–90%, indicating recurrent delays and inefficient internal material flow [2].
Material Requirements Planning (MRP) supports material demand planning in multi-component, make-to-order environments. A 2022 study incorporating a stochastic MRP cut backorders by over 50%, reduced total cost by 23%, and improved service levels by 18%, enhancing planning stability under demand variability [3]. In 2023, MRP outperformed Reorder Point System (RPS) and Constant Work In Process (CONWIP) in cycle times and logistics cost reduction, improving warehouse–production coordination and preventing stockouts and delays [4].
ABC classification prioritizes materials based on value or turnover. In a 2023 metalworking case, the integration of ABC with the 5S methodology and Systematic Layout Planning (SLP) reduced defects by 12% and increased productivity by 15% [5]. Similarly, a 2021 application in a Chinese supermarket distribution center improved storage efficiency from 87.7% to 96.5% and order accuracy from 97.3% to 100% by reorganizing the layout according to item criticality [6]. SLP optimizes internal layouts to improve flow; a 2022 automotive case, productivity was increased and labor costs were reduced by 40% [7]. In Peru, the application of SLP combined with process standardization increased the On-Time In-Full (OTIF) rate from 53.6% to 92.9% [8].
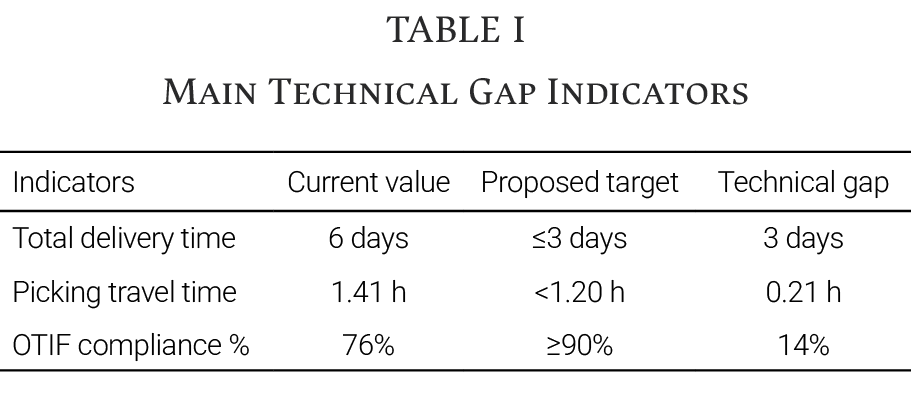
In the Peruvian metalworking sector, internal supply delays of 5–7 days and 38% of urgent internal orders—well above the <10% threshold—have been reported [8]. This study applies MRP, ABC, First-In, First-Out (FIFO), and SLP to cut supply times to ≤3 days by improving planning, inventory management, and layout design. The hypothesis is that integrating these tools will reduce supply times and urgent orders, improving OTIF (approximately 76% vs. 90% target) [9], Table I while boosting productivity and controlling costs. Validation involved a 9-month pilot, simulation modeling, and economic, social, and environmental analyses.
- Methods
This study employs a quantitative methodology based on the collection, analysis, and comparison of measurable data, following a quasi-experimental design with a planned intervention. It focuses on the internal material supply flow—from valve pinch request to receipt in production—as outlined in the problem tree (Fig. 1).
A Lean Warehousing approach was applied following the diagnostic phase, which included plant observations, staff interviews, and Enterprise Resource Planning (ERP) snapshots [10]. The unit of analysis was internal supply time for pinch valve orders [11]. Using non-probabilistic convenience sampling (January 2023–June 2025), the model was validated in a nine-month pilot test (October 2024–June 2025) with 540 orders, Arena simulations (AS-IS vs. TO-BE), and economic, social, and environmental assessments.
Data were collected using tailored forms, calculation sheets, and direct observation, capturing supply times, layout distances, inventory levels, and order frequency—thus supporting bottleneck identification and layout mapping.
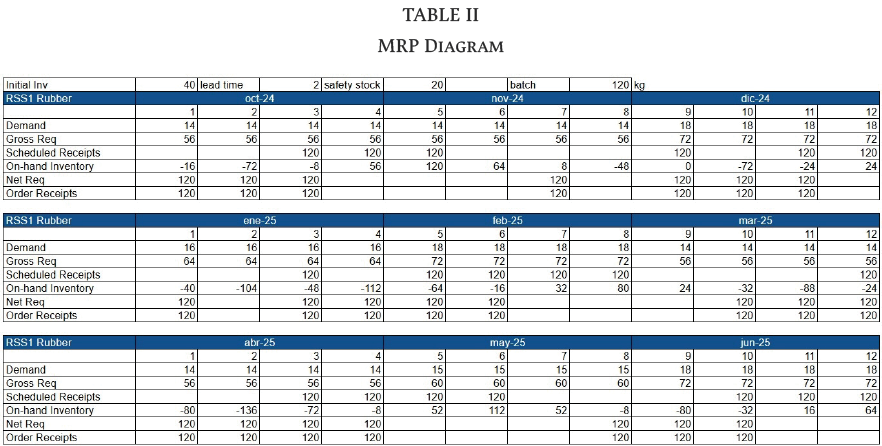
The Gozinto diagram in Fig. 2 displays the hierarchical structure of inputs for producing the 4x16” pinch valve model, while the MRP plan for RSS1 rubber is detailed in Table II.
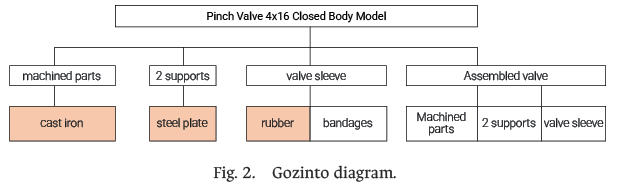
- Type: First-phase MRP (no finite capacity).
- 1 valve = 5 cast parts + 1 steel plate + 0.2 kg RSS1 rubber.
- Horizon: Oct 2024–Jun 2025 (10 valves/month).
- Demand: 30–40 monthly valve orders.
- Key parameters: fixed lot sizes, per-input lead times, initial inventory, safety stock.
The MRP formulas used include the available inventory calculation and the order release condition, as shown in (1) and (2).
 (1)
(1)
 (2)
(2)
If an order is released in week , the receipt occurs as defined in (3).
 (3)
(3)
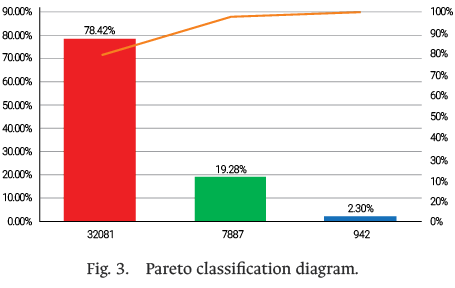
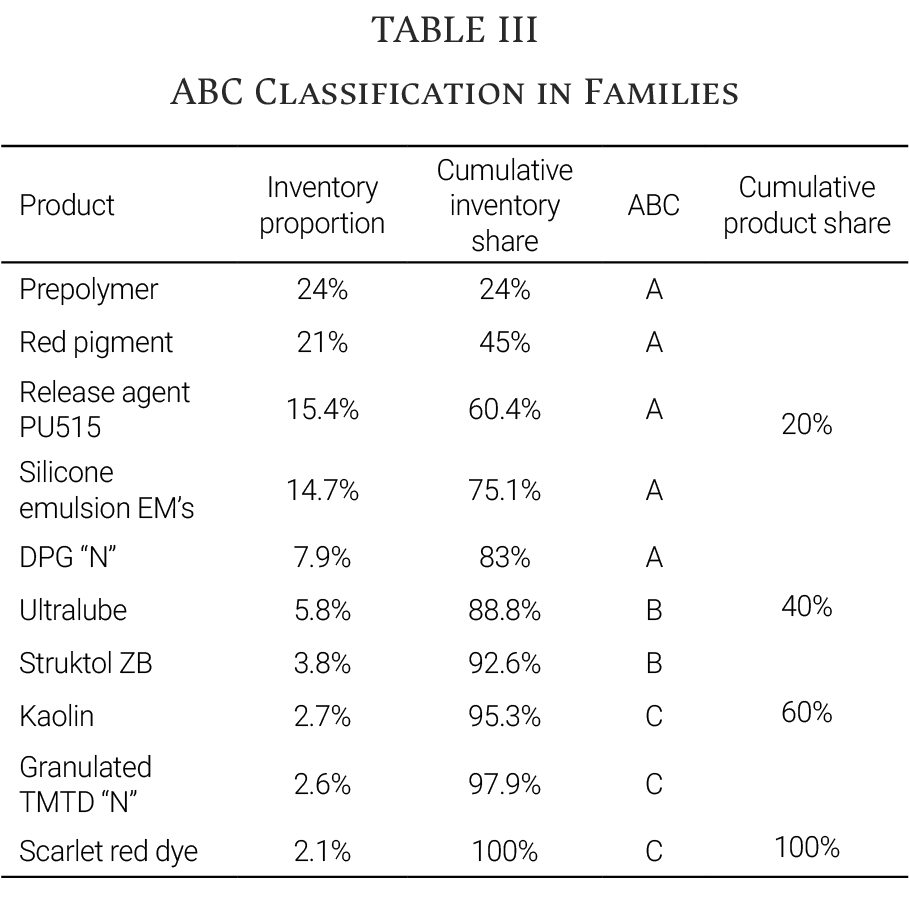
The ABC classification applied in the chemical warehouse began with collecting inventory data, organizing materials within the software, and classifying them based on their contribution to total inventory cost. Among 28 chemical inputs, items were grouped into 10 material-type families in Table III. Weekly data collection enabled the construction of a Pareto diagram in Fig. 3 showing Type A (highest cost), Type B (next 20%), and Type C (remaining items).
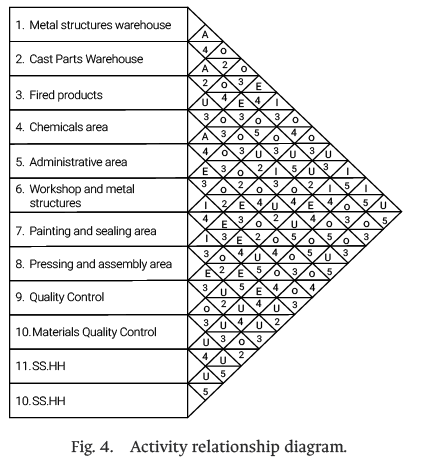
After organizing the materials warehouse, shelves were labeled according to material type and chemical product expiration dates. The SLP tool was then applied using proximity analysis and an activity relationship diagram (Fig. 4) to reorganize material transfer areas toward production, as shown in the layout presented in Fig. 5. Table IV lists time and distance data from sequential area movements, starting from production requests. Route crossings were identified among the chemical warehouse, the cast parts warehouse, and the material quality control area.
The model was validated by comparing the simulated processing time with the actual historical time of 48 h. In addition, the Arena Input Analyzer module, summarized in Table V, was used to determine the input probability distributions for each process shown in Fig. 6.
The procedure, supported by prior diagnosis and data collection, included training activities, tool monitoring, and periodic reviews. The model was validated through Arena simulations of the AS-IS scenario, shown in Figs. 7 and 8, which represent the supply flow from request generation to production [12]. This approach enables scenario modeling, integrates real-time data, and accounts for process constraints. The key performance indicator (KPI) analysis presented in Table VI demonstrates significant improvements in material flow without requiring high capital investment.
The simulation was executed with 62 replications, in accordance with standard sample size determination formulas commonly used in inventory simulation studies [13].
 (4)
(4)
The performance indicators obtained from the simulation are presented in Fig. 9, which represents the company’s current operational state.
- Results
Data on processing and waiting times, logistics routes, inventory turnover, RQ fulfillment, and layouts were collected. ERP screenshots and evidence of MRP and layout changes supported the TO-BE simulation.
Quantitative analysis used averages, percentages, and fulfillment rates. Arena simulations ran 62 replications per scenario (AS-IS, First, Second) at 95% level confidence.
In Scenario 1, MRP and ABC classification were implemented, with Technical Control approval set at 90% and Quality Control approval at 95%. Component supply was modeled using an Assign module, as defined in (5).
(5)
Fig. 10 shows improved indicators over the current model in Fig. 7 and Fig. 8.
The improvement was achieved through the implementation of the SLP tool and the corresponding layout modification in the study area. Fig. 13 illustrates the improvement in performance indicators compared with the initial AS-IS simulation. In addition, Fig. 11 and Fig. 12 display the Arena model, highlighting the improvements resulting from the integrated implementation of all proposed tools.
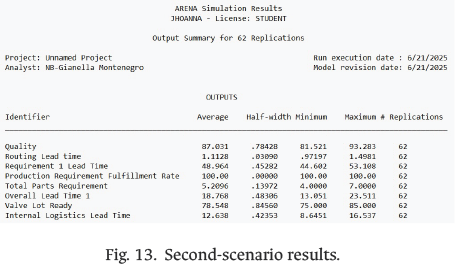
In the second scenario, the total delivery time, shown in Fig. 14, decreased from 46.39 to 18.76 h (−59.6%) as a result of improved planning through MRP and the elimination of delays. Internal logistics time also decreased, from 18.76 to 12.8 h (−31.8%), driven by the implementation of SLP and the ABC-based prioritization of Type A materials near the dispatch area.
These results indicate a clear optimization of internal logistics, with a positive impact on operational efficiency.
Fig. 15 displays the variation in average picking travel time before and after the implemented improvements.
- In the AS-IS model, the average was 1.32 h, reflecting a dispersed and inefficient layout.
- With the application of SLP and ABC prioritization in the second scenario, this value was reduced to 1.11 h (-15.9%).
This result is consistent with the findings reported in [14], which indicate that SLP improves access to critical materials and reduces unnecessary movements in logistics warehouses.
Fig. 16 displays the key efficiency indicators: production RQ fulfillment increased from 76% to 100% through the implementation of MRP, enabling demand-based planning; moreover, the product quality rate rose from 77.33% to 87% as a result of reduced urgent deliveries and improved storage conditions that prevent material deterioration. These outcomes corroborate the findings reported in [15], indicating that the integration of MRP with functional layout design enhances OTIF performance and final product quality.
A comparative analysis was conducted between the AS-IS and the best scenarios to evaluate the impact of the tools applied (MRP, ABC, SLP). Table VII summarizes the KPIs obtained from the Arena simulation.
Prior to implementing the MRP system, material planning in the valve pinch line was reactive and decentralized. Requests for critical materials—such as RSS1 rubber, cast parts, and steel plates—were generated manually after receiving production orders, with no planning horizon, safety stock levels, or supplier lead times considered in Fig. 17.
This resulted in frequent urgent orders, production rescheduling, and inefficient use of logistics resources.
With the application of first-phase MRP, in Fig. 18 forward planning was esta-blished based on average monthly consumption, lead times, fixed order sizes, initial inventory, and safety stock. This enabled earlier ordering, improved inventory coverage, and ensured timely availability of materials, reducing stockouts and delays.
The warehouse diagnosis revealed a disorganized layout lacking prioritization by material criticality or consumption value, which resulted in excessive travel distances, picking errors, and long search times. The application of ABC classification enabled a reorganization of the layout, positioning Type A inputs near the dispatch area and assigning Types B and C to secondary storage zones. Fig. 19 shows the improved layout prototype. This redesign reduced search time by 20% and improved control of key items, consistent with previous findings [16].
Prior to the improvement, the warehouse layout was inefficient, with critical materials dispersed throughout the facility, resulting in excessive travel distances, route overlaps, and operational delays. Fig. 19 displays low-turnover items placed closer to dispatch than high-priority ones. In the second and best scenario, the SLP methodology redesigned the internal flow, emphasizing proximity, frequency, and activity compatibility as shown in Fig. 20. This reduced operator travel time and improved access to key materials, as also demonstrated in [14], where SLP increased productivity by up to 30% by minimizing idle time and movement.
Overall, the results show notable improvements in internal supply to production through the combined application of MRP, ABC classification, and SLP. The reduced logistics times (Table VIII), higher fulfillment rates, and better access to critical materials confirm the effectiveness of the proposed redesign. These outcomes result from the integration of planning, inventory segmentation, and layout reorganization, aligned with the study’s objectives.
- Discussion
The findings indicate a 59.6% reduction in total delivery time and a 24% increase in the fulfillment rate of material requests (RQ), thereby validating the initial hypothesis. The implementation of MRP enabled the anticipation of actual production demand, reducing urgent orders and stockouts. These results are consistent with those reported in [17], which show that MRP can reduce supply failures by more than 20% in custo-
mized manufacturing environments.
ABC classification facilitated the prioritization of critical materials, thereby improving inventory turnover. This result is consistent with the findings reported in [18], where the application of this technique enabled a reduction in obsolete stock in industrial logistics warehouses. Finally, the implementation of SLP enabled shorter and more organized material handling routes. This result is consistent with the findings reported in [14], which document efficiency improvements of up to 30% through well-planned physical layout redesigns.
A key strength of this research lies in its practical approach, combining real-world field implementation with simulation-based validation to enable a comparative analysis of system performance before and after each tool’s application. Despite the positive results obtained, it should be noted that the implemented MRP model followed a first-phase approach, without incorporating finite capacity constraints or advanced demand forecasting. This is because the company operates under a make-to-order production system, where demand is defined by specific orders. Furthermore, although this study focused on a critical production line (pinch valves), the applied methodology can be replicated across other production lines or warehouses within the company. These considerations do not diminish the value of the work; instead, they open opportunities for future research to extend opportunities for future research to deepen the analysis with complementary tools and broader organizational coverage.
- Conclusion
The results of the study confirm the proposed hypothesis: the combined application of MRP, ABC classification, and SLP significantly reduces internal supply times in a make-to-order metal-mechanical company. Specifically, total delivery time decreased by 59.6% (from 46.39 to 18.76 h), internal logistics time was reduced by 31.8% (from 16.7 to 12.8 h), and average picking time declined by 15.9% (from 1.32 to 1.11 h). In addition, the production requirement (RQ) fulfillment rate increased by 23 percentage points (from 76% to 100%), and the product quality rate improved by nearly 10 percentage points (from 77.33% to 87%). These improvements were validated through Arena simulation (62 replications at a 95% confidence level) and a nine-month pilot implementation involving 540 valve orders, demonstrating that the integration of these logistics tools effectively optimizes critical material flows, reduces urgent orders, and enhances operational reliability in Peruvian industrial environments.
References
[1] Ministerio de Producción del Perú, “Reporte de Producción Manufacturera [Manufacturing Production Report],” Ministerio de Producción del Perú, Lima, Perú, Apr. 2022. [Online]. Available: https://ogeiee.produce.gob.pe/index.php/en/shortcode/oee-documentos-publicaciones/boletines-industria-manufacturera/item/1047-2022-abril-reporte-de-produccion-manufacturera
[2] A. Anton, M. Roque, and E. Ramos, “Lean warehousing model to improve the order fulfillment in a metalworking company,” in 8th Int. Conf. Ind. & Bus. Eng. (ICIBE 2022), Jan. 2023, pp. 90–95, doi: https://doi.org/10.1145/3568834.3568881
[3] S. Thevenin, Y. Adulyasak, and J. Cordeau, “Material requirements planning under demand uncertainty using stochastic optimization,” Prod. Oper. Manag., vol. 30, no. 2, pp. 475–493, Feb. 2021, doi: https://doi.org/10.1111/poms.13277
[4] M. He, Z. Guan, C. Wang, and G. Hou, “A shipborne dense storage warehouse system based on two-way transportation line strategy,” in 5th Int. Conf. Ind. Eng. Ind. Manag. (IEIM 2024), Nice, France, Mar. 2024, pp. 215–223, doi: https://doi.org/10.1007/978-3-031-56373-7_17
[5] A. D. Valdivia Alfaro, G. S. Renteria Nuñez, and A. E. Flores Perez, “Implementation of 5S, SLP, standard work, ABC and minimum and maximum system in a warehouse in Metropolitan Lima,” in 6th Int. Conf. Manag. Sci. Ind. Eng. (MSIE 2024), Bangkok, Thailand, Aug. 2024, pp. 351–358, doi: https://doi.org/10.1145/3664968.3665016
[6] H.-L. Lin and Y.-Y. Ma, “A new method of storage management based on ABC classification: A case study in Chinese supermarkets’ distribution center,” Sage Open, vol. 11, no. 2, Jun. 2021, doi: https://doi.org/10.1177/21582440211023193
[7] E. Leon-Enrique, V. Torres-Calvo, M. Collao-Diaz, and A. Flores-Perez, “Improvement model applying SLP and 5S to increase productivity of storaging process in a SME automotive sector in Peru,” in 3rd Int. Conf. Ind. Eng. Ind. Manag. (IEIM 2022), Barcelona, Spain, May 2022, pp. 219–225, doi: https://doi.org/10.1145/3524338.3524372
[8] R. F. P. Llanos Reyes, K. F. Flores Zorrilla, and M. F. Collao Diaz, “Service model based on lean manufacturing, SLP and process standardization to increase the service level of an SME in the metal-mechanic sector,” in 6th Int. Conf. Inf. Manag. Manag. Sci. (IMMS 2023), Chengdu, China, Nov. 2023, pp. 207–213, doi: https://doi.org/10.1145/3625469.3625513
[9] A. Briones-Chávez, N. Sandoval-Soldevilla, and J. C. Quiroz-Flores, “Applying lean warehousing tools to improve OTIF: A case study in a logistics SME in the freight transportation sector in Peru,” Int. J. Mech. Eng., vol. 12, no. 1, pp. 113–126, Jan. 2025, doi: https://doi.org/10.14445/23488360/IJME-V12I1P113
[10] Y. A. Añazco-Alavedra and J. C. Quiroz-Flores, “Lean warehousing, 7S and SLP tools to improve productivity in the inspection and storage process in a spare parts warehouse of an automotive retail company,” in 5th African Int. Conf. Ind. Eng. Oper. Manag. (AIEOM 2024), Pretoria, South Africa, Apr. 2024, doi: https://doi.org/10.46254/af05.20240203
[11] Z. J. Ye et al., “Resilience patterns and transitions in the Be Resilient to Breast Cancer trial: An exploratory latent profile transition analysis,” Psycho-Oncology, vol. 30, no. 6, pp. 901–909, Jun. 2021, doi: https://doi.org/10.1002/pon.5668
[12] M. A. A. Abd Ghafar and F. Mohamad, “Warehouse performance improvement during big event using discrete event simulation approach: A case study of food and beverages company in Shah Alam,” J. Gov. Integr., vol. 6, no. 1, pp. 415–425, May 2023, doi: https://doi.org/10.15282/jgi.6.1.2023.7544
[13] S. Ahmed Khan, F. Dweiri, and A. Chaabane, “Managing warehouse inventory: A simulation-based case study,” presented at 11th Int. Conf. Model., Optim. Simul. (MOSIM 2016), Montréal, QC, Canada, Aug. 2016. [Online]. Available: https://www.researchgate.net/publication/307173457
[14] J. Lee and C. Yang, “Deep neural network and meta-learning-based reactive sputtering with small data sample counts,” J. Manuf. Syst., vol. 62, pp. 703–717, Jan. 2022, doi: https://doi.org/10.1016/j.jmsy.2022.02.004
[15] J. L. Adrianzén-Nuñez, G. Berrospi-Gálvez, M. F. Collao-Díaz, and J. C. Quiroz-Flores, “Optimizing logistics and inventory management in SMEs: Integrating economic order quantity and systematic layout planning in a Peruvian distribution company,” in 9th North American Conf. Ind. Eng. Oper. Manag. (NAIEOM 2024), Washington, DC, USA, Jun. 2024, doi: https://doi.org/10.46254/NA09.20240278
[16] X. Shen and B. Lin, “Does industrial structure distortion impact the energy intensity in China?,” Sustain. Prod. Consum., vol. 25, pp. 551–562, Jan. 2021, doi: https://doi.org/10.1016/j.spc.2020.12.012
[17] G. Wang, W. Peng, and L. Zhang, “Estimate of population density and diagnosis of main factors of spatial heterogeneity in the metropolitan scale, western China,” Heliyon, vol. 9, no. 6, e16285, Jun. 2023, doi: https://doi.org/10.1016/j.heliyon.2023.e16285
[18] R. Seiger, L. Malburg, B. Weber, and R. Bergmann, “Integrating process management and event processing in smart factories: a systems architecture and use cases,” J. Manuf. Syst., vol. 63, pp. 575–592, Apr. 2022, doi: https://doi.org/10.1016/j.jmsy.2022.05.012