Proposal to Enhance Productivity by Applying Lean
Manufacturing Tools in a Fish Canning Company
Flavia Espinoza-Montero1 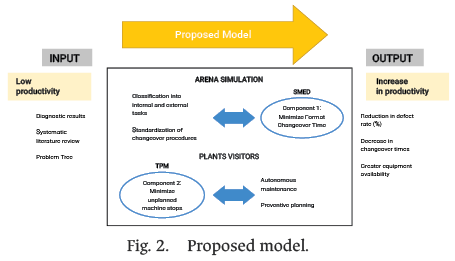 , Rodrigo R. Quintanilla-Chalan2 , Jorge A. Corzo-Chavez3 ,
Gino Viacava-Campos4
1 [email protected], 2 [email protected], 3 [email protected], 4 [email protected]
1234 Carrera de Ingeniería Industrial, Universidad de Lima, Perú.
Received: 19 July, 2025 / Accepted: 5 November, 2025 / Published: 5 June, 2026
https://doi.org/10.26439/ciii2025.8647
Abstract—This project presents the design and partial implementation of a productivity improvement model based on Lean Manufacturing principles in a fish canning company. The approach involved a technical diagnosis and root cause analysis to identify key operational inefficiencies, primarily related to frequent equipment stoppages, prolonged changeover times, and a lack of process standardization. To address these issues, Total Productive Maintenance (TPM) and Single-Minute Exchange of Die (SMED) methodologies were applied, and their impact was assessed through simulation using Arena software. Results revealed significant productivity improvements. Labor productivity increased from 6 to 7 units/h, while annual defective output decreased from 372,370 to 86,310 cans. Changeover times were reduced from 23.8 to 8.1 min, and equipment failure rates declined from 13.67% to 4.59%. These improvements contributed to a higher level of Overall Equipment Effectiveness (OEE). Additionally, the project enhanced operator skills, increased process stability, and strengthened operational discipline. The study demonstrates that Lean Manufacturing tools can be successfully adapted to the realities of small-scale fish processing operations, offering a viable pathway to boost competitiveness, reduce waste, and meet the demands of increasingly rigorous markets.
Index Terms—Fish processing industry, industrial production, simulation, SMED, TPM.
- Introduction
The fishing sector in Peru plays a crucial role in the national economy, leading global exports of fishmeal and fish oil, mainly derived from anchoveta. In 2024, canned fish exports reached approximately USD 95 million FOB, representing a 64.5% increase compared to the previous year. The main destination markets were the United Kingdom, the United States, the Netherlands, Spain, Chile, and Germany. This growth was primarily driven by canned tuna products, which accounted for 87.5% of total export value, followed by anchoveta (8.3%), horse mackerel (1.9%), abalone (1.3%), and mackerel (0.9%) [1]. The sector generates significant employment and contributes to Gross Domestic Product (GDP); however, it faces critical challenges, including the El Niño and La Niña phenomena, which alter oceanographic conditions and reduce anchoveta populations, alongside historical overexploitation and illegal fishing. These issues have led the government to implement strict regulations, including catch quotas and closed seasons, to ensure sustainability. Despite informality and infrastructural limitations, artisanal fishing remains vital for food security and the livelihoods of coastal communities. Aquaculture is gaining importance through products such as trout and shrimp, diversifying exports, however this sub-sector still faces financing and technological barriers. Additionally, certifications such as the Marine Stewardship Council (MSC) are becoming increasingly relevant, enhancing competitiveness in international markets that demand sustainable products.
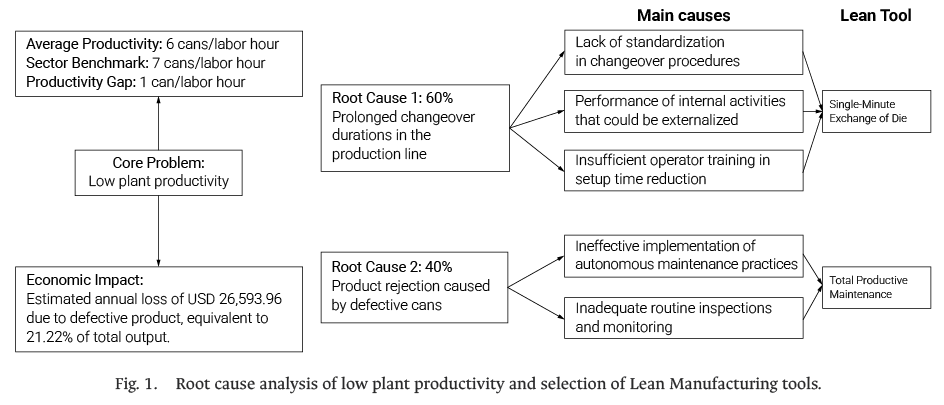
Within this context, the studied company is a medium-sized fish canning processor operating two 8-hour shifts with an installed capacity of 180 tons per shift. However, it currently operates below its potential. Key operational issues include obsolete machinery, frequent unplanned equipment breakdowns due to inadequate preventive maintenance, lack of work standardization, and bottlenecks in manual processes. These problems resulted in low productivity, which the company aims to increase. The benchmark analysis was conducted to a case study of improvements in a food company that applied the same lean manufacturing tools, such as SMED and TPM, achieving an 8.11% increase in productivity [2]. This situation significantly affects profitability and competitiveness, as illustrated in Fig. 1. These baseline values, obtained from the company’s internal production reports (2023), served as the main reference for defining the improvement objectives and identifying the root causes and corresponding Lean tools.
A systematic literature review was conducted following the PRISMA methodology. From an initial set of 543 publications, 40 studies met the inclusion criteria, focusing on Lean Manufacturing tools such as Total Productive Maintenance (TPM) and Single-Minute Exchange of Die (SMED). The reviewed studies demonstrated that TPM improves equipment availability and reduces failure rates, while SMED significantly decreases changeover times, leading to higher productivity and lower operational costs across various manufacturing sectors, including food processing. Notable findings include a 5% increase in Overall Equipment Effectiveness (OEE) through TPM implementation [3] and improvements in quality performance from 49.44% to 94.64% in metalworking industries using integrated Lean tools [4].
The general objective of this project is to design and partially implement a Lean Manufacturing-based management model to increase productivity in canned fish production. The specific objectives are to diagnose the main causes of production inefficiency through process and time analysis, conduct a systematic literature review on Lean Manufacturing applications in fish processing SMEs, propose improvement solutions based on TPM and SMED methodologies, and validate the proposed improvements simulation using Arena software.
This study addresses this gap by offering practical insights into the optimization of core operations in fish canning, a sector often overlooked in academic research. It contributes applicable knowledge that supports decision-making, strengthens operational performance, and fosters innovation in production systems under real industrial constraints, expanding the scope of engineering solutions in environments where traditional approaches may not be feasible.
- Methodology
The diagnosis of the production process allowed the identification of key inefficiencies related to equipment stoppages, extended setup times, and lack of process standardization. Based on these findings and supported by the review of previous studies, three Lean Manufacturing tools were selected as part of the improvement strategy. SMED methodology was applied to reduce changeover time in the sealer, a stage characterized by non-standardized activities and frequent delays. Prior evidence indicates that this tool can reduce setup times by more than 30%, contributing to increased equipment availability and production flow. TPM was used to address the high frequency of unplanned machine downtimes, especially in the autoclave area. This tool enhances operator involvement in basic maintenance tasks and aims to minimize failures by improving equipment reliability. To define the size of the study sample, it was assumed that the company records an average of 220 productivity-impacting events per month, including autoclave downtimes and sealer changeovers. A sample size calculation was performed, assuming a confidence level of 95% and a margin of error of 5%, yielding the minimum number of replications required:
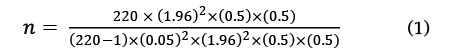
By solving the values into (1) yielded a minimum sample size of approximately 141 observations. The main variables analyzed in this study were production time, equipment availability, failure rate, and defect percentage. These indicators formed the basis for quantifying the impact of the proposed improvements, which were evaluated through simulation modeling using real production data from the plant.
A non-probabilistic convenience sampling method was used, as the study included all available critical occurrences during one month of normal plant operation [5]. The approach prioritized the rapid and efficient collection of real data on issues directly affecting plant efficiency. Only autoclave downtimes and sealer changeovers that impacted the regular production process were considered. To ensure consistency and alignment with the project objectives, specific inclusion and exclusion rules were defined. The inclusion criteria encompassed all documented autoclave downtimes and sealer changeovers during the selected month, provided that they were recorded in production reports or operational logs and occurred under normal operating conditions. Exclusion criteria applied to downtimes or changeovers resulting from scheduled or extraordinary maintenance, as well as events caused by external factors such as power outages or natural phenomena. Records without supporting documentation or containing incomplete data were excluded from the analysis.
Based on these tools, a structured improvement model was developed to guide the implementation strategy, as illustrated in Fig. 2.
A. Component 1: Minimize Format Changeover Time
The analysis of current format changeover times revealed high variability and the presence of unproductive periods caused by poorly organized internal activities. To address this issue, the SMED methodology was proposed to reduce these times and transition from a reactive approach to a standardized one. A detailed time study was conducted during changeovers in the sealing line, with each task chronometrically recorded. For example, seal replacement currently requires 4.5 min and gasket inspection 2 min, both performed while the machine is stopped. Under the SMED proposal, these activities were externalized, reducing internal setup time from 12.9 to 5.3 min. This task reclassification and redistribution were incorporated into the Arena simulation model to validate the expected improvements in equipment availability and production flow. Based on this analysis, standardized procedures and optimized task sequences were developed and implemented in the simulation. The estimated reduction in changeover time was used as an input parameter to project its impact on the overall production flow.
A flowchart illustrating these activities is shown in Fig. 3.
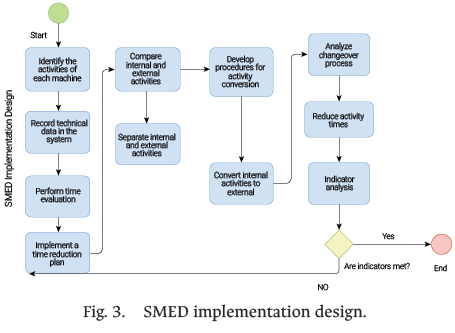
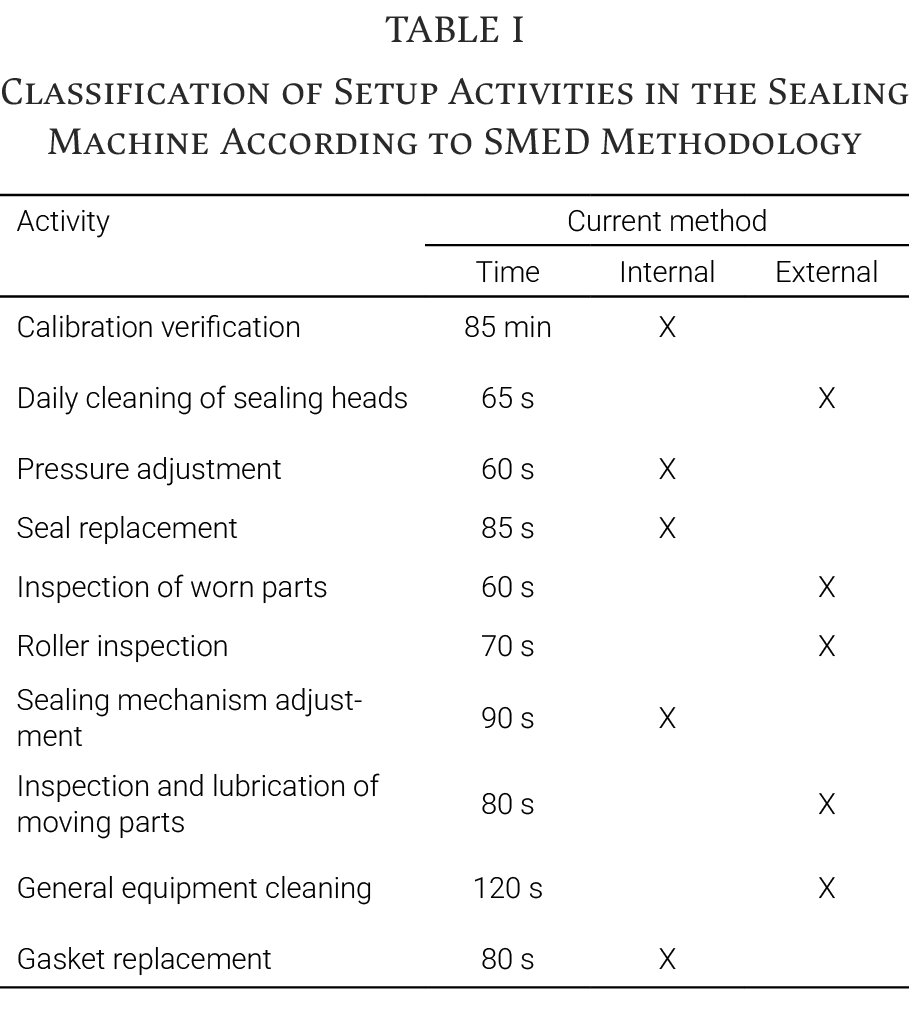
Table I presents the classification of the current setup activities performed on the sealing machine, distinguishing between internal and external tasks according to the SMED methodology. A total of ten activities were identified, five of which are currently carried out while the machine is stopped (internal), and five that can be or are already performed externally. This breakdown served as the basis for identifying improvement opportunities, particularly by proposing the externalization of tasks such as material preparation, cleaning, and preliminary inspections to reduce overall changeover time.
By applying the SMED methodology, setup activities were restructured to distinguish between internal and external tasks, aiming to minimize machine downtime. As presented in Table II, the proposed improvements resulted in the following optimized times: sealing head verification and cleaning (70 s), inspection of worn parts (55 s), adjustment of sealing mechanisms (90 s), general equipment cleaning (120 s), and gasket replacement (80 s).
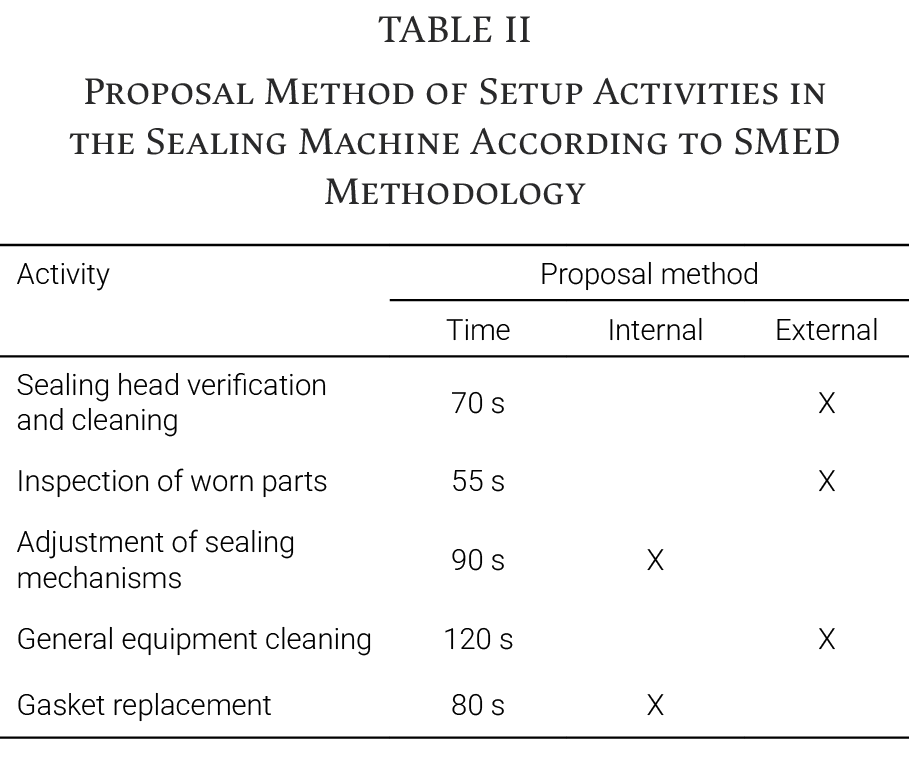
These changes reduced the proportion of internal activities by transferring non-critical operations to external preparation and by standardizing procedures such as mechanism adjustment and gasket installation. Consequently, the overall setup process became more efficient, leading to increased equipment availability and a reduced productivity losses caused by extended changeover times.
B. Component 2: Minimize Unplanned Machine Stops
The second intervention component focuses on the implementation of basic TPM practices, targeting equipment with high failure frequency, specifically the sealer and the autoclave. The most frequent failures and their repair times were analyzed to prioritize the assets requiring intervention.
The plan specified concrete actions such as: (1) daily lubrication of sealing heads and inspection of worn parts, (2) weekly calibration of pressure sensors and inspection of hinges, and (3) monthly cleaning of filters and verification of control instruments. To strengthen operator involvement, visual control boards for abnormal conditions and a simplified system for recording minor incidents were introduced. These measures aimed to reduce recurrent stoppages in the autoclave and sealing machines, thereby increasing Mean Time Between Failures (MTBF) and reducing Mean Time to Repair (MTTR). Information regarding the expected improvements in equipment availability—specifically variations in MTBF and MTTR—was included as input parameters in the Arena simulation model to analyze their impact on overall productivity.
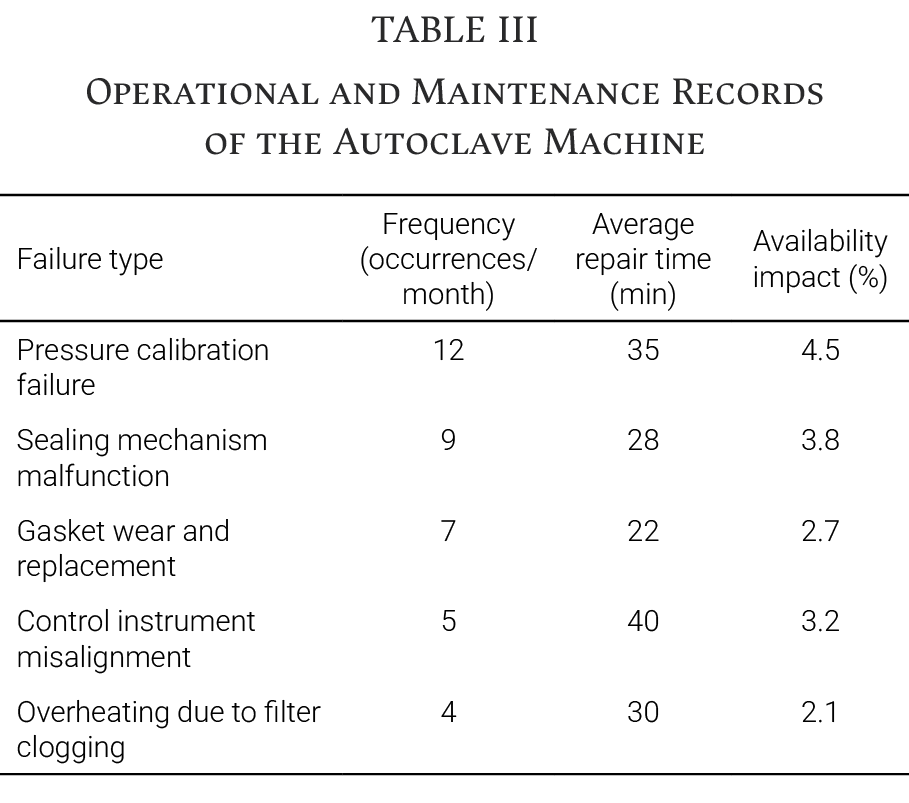
Table III presents the operational and maintenance records of the Autoclave, which shows a higher frequency of unplanned stoppages and unexpected failures compared to other equipment in the process. To improve clarity, failures were classified by type, frequency, average repair time (min), and estimated impact on equipment availability. This breakdown highlights recurring issues such as pressure calibration errors, sealing mechanism malfunctions, and wear in critical components, which justified prioritizing the autoclave in the TPM intervention plan. The proposed actions focused on preventive measures including filter cleaning, hinge lubrication, and regular inspection of control instruments. The observed variability in equipment availability and product quality underscores the need for structured maintenance routines to ensure process reliability and minimize downtime.
A detailed TPM model was constructed, as shown in Fig. 4, to identify key preventive maintenance activities for the sealing and autoclave machines. The model incorporated the average duration of each intervention along critical decision points, enabling the simulation of their impact on operational continuity and overall process efficiency.
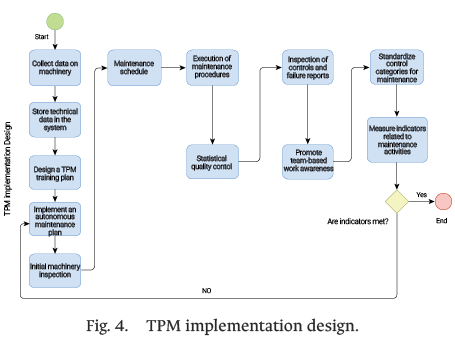
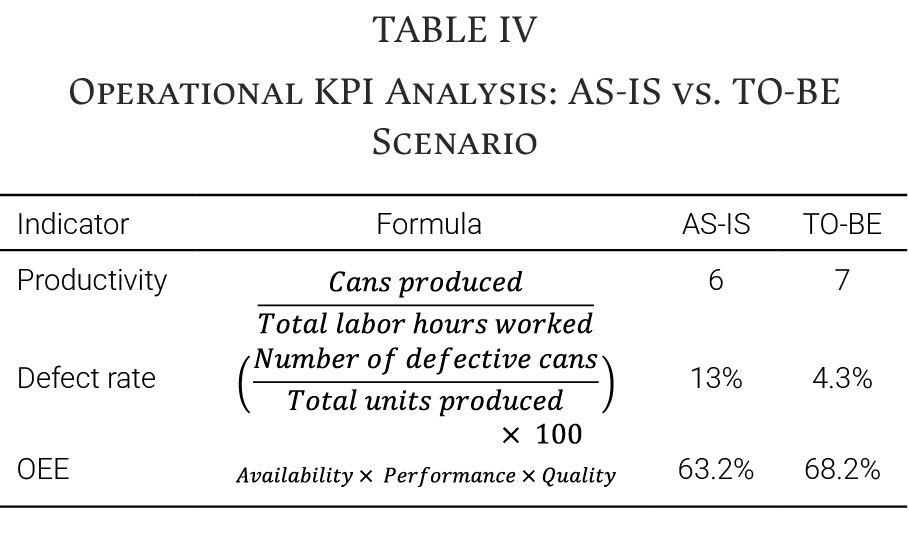
Table IV presents a comparative analysis of key operational performance indicators before and after the proposed improvements. The AS-IS column reflects the current performance of the plant, while the TO-BE scenario represents the expected outcomes after implementing the Lean Manufacturing strategies. The selected indicators—productivity, defect rate, and OEE—provide a clear overview of the potential impact on efficiency and quality.
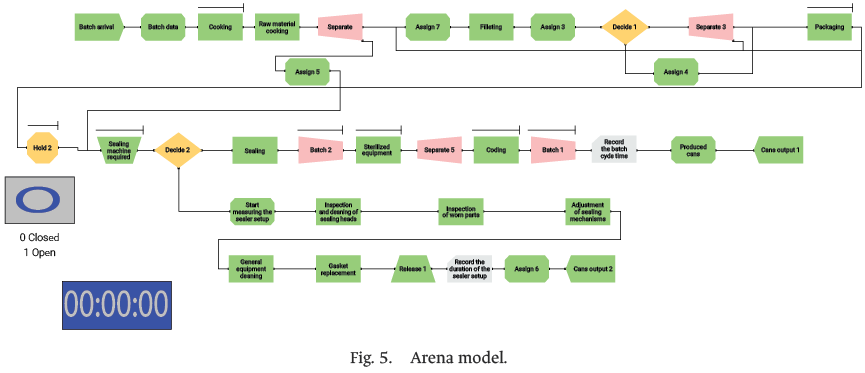
The Arena simulation model shown in Fig. 6 was designed to replicate the actual production flow of the fish canning plant, with a particular focus on identifying while quantifying the impact of inefficiencies related to changeover times and unplanned equipment downtime. The process was mapped from the arrival of raw material batches through the main transformation stages—including cooking, filleting, sealing, sterilization, and packaging—incorporating key decision points, resource constraints, and batch processing logic.
Each block in the model represents a specific operation or activity using Arena’s standard modules, such as Process, Assign, Decide, and Separate. The sealing machine, which was central to the SMED intervention, was modeled with conditional logic to simulate equipment occupancy and the changeover routine. Additional logic flows were introduced to capture detailed maintenance procedures, such as cleaning, gasket replacement, and sealing mechanism adjustments, allowing for a realistic representation of the setup phase. Time data used in the model were obtained through direct measurement and field observation and were entered as input parameters to evaluate both the AS-IS and TO-BE scenarios.
To determine the appropriate number of simulation replications and ensure the statistical reliability of the output data, an initial run of 30 replications was executed. This resulted in an average production of 371,590, cans with a 95% confidence interval ranging from 369,961 to 373,219. The calculated half-width (h0) of the interval was 1,628.8. Based on a desired error margin of 814.4 cans—equivalent to 2.2% of the sample mean—a statistical formula was applied to estimate the required number of replications. Consequently, it was determined that 120 replications were necessary to achieve the desired level of precision in the simulation results, thereby ensuring a high level of statistical confidence in the system performance analysis.
- Results
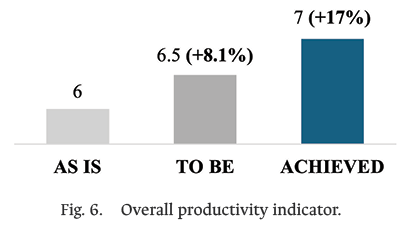
Once the Arena simulation was completed, outcomes were collected for the five defined performance indicators and compared against their respective target values. The key indicator under analysis was overall productivity, which initially measured 6 cans per labor hour. Following the proposed improvements, the simulation demonstrated a 17% increase, reaching 7 cans per labor hour, as shown in Fig. 5.
Regarding the setup time indicator, the process originally required 12.9 min, with a target reduction to 5 min. The simulation results closely approached this objective, achieving a setup time of 5.3 min—representing a 59% decrease, as illustrated in Fig. 7.
Regarding the cycle time per batch indicador, the process initially recorded 28.5 min with a target reduction of 40%. The experimental results closely approached the expected value, as illustrated in Fig. 8, thereby achieving a reduced cycle time of 18.8 min—representing a 34% decrease.
For the defective cans indicator, the initial figure was 372,370 cans per year, with a target of 180,000. As shown in Fig. 9, the experimentation reduced this number to 187,895 cans annually—a 50% decrease. Although the target was not fully achieved, the outcome still reflects a substantial improvement in process consistency, quality control, and financial performance, reinforcing the effectiveness of Lean tools in addressing persistent quality issues within fish canning operations.
Finally, as illustrated in Fig. 10, the OEE indicator initially stood at 63.2%, with a target of 85%. The experimentation closely approached the expectations, raising the OEE to 78.6%, which represents a 24% improvement.
The comparative analysis between the AS-IS and TO-BE models, based on 120 replications each, demonstrates a statistically significant reduction in the average batch cycle time. The AS-IS model reported an average of 712 min per batch (95% CI: [711, 713]), while the TO-BE model achieved a reduced average of 696 min per batch (95% CI: [696, 697]). This 16-min decrease in batch cycle time reflects the impact of the proposed Lean improvements, particularly the implementation of SMED and TPM strategies, as shown in Fig. 11.
As the batch cycle time directly influences throughput, this reduction enabled the system to process a higher number of batches within the same operational timeframe. Consequently, the number of cans produced per simulation period increased without requiring additional resources. Assuming the standard batch configuration of 26 cans and 10 operators working over an 8-h shift, this improvement translated into a measurable increase in system productivity.
The post-improvement simulation increase from approximately 6 to 7 cans per labor hour, representing a 17% improvement in labor efficiency. The narrow confidence intervals and the non-overlapping ranges between models confirm the statistical significance of this improvement. Therefore, the simulation results validate the effectiveness of the implemented Lean Manufacturing tools in optimizing operational performance and achieving the targeted productivity level.
- Discussion
The implementation of Lean Manufacturing tools, specifically SMED and TPM, as part of a process improvement model had a significant positive impact on the productivity and operational efficiency of the fish canning plant under study. The main productivity indicator—the number of cans produced per batch—increased from 4,400 to 6,650 units, representing a 51% improvement. This outcome significantly exceeded initial expectations and is consistent with previous studies that highlight the effectiveness of lean manufacturing tools in improving operational efficiency such as a metalworking case study [6]. The success of the model lies in its capacity to address multiple factors simultaneously: reducing setup times, improving equipment availability, and minimizing process defects.
In the first component, focused on setup time management, the application of the SMED methodology enabled the classification, simplification, and standardization of internal setup activities. As a result, the setup time of the sealing machine was reduced from 12.9 to 5.3 min, a 59% reduction, almost reaching the targeted 5-min objective. This aligns with Shingo’s foundational work on SMED [7], as well as with findings by Arboleda and Rubiano [8], who reported similar reductions in the food sector.
The second component addressed preventive and autonomous maintenance under the TPM framework. Procedures, checklists, and staff training were implemented to reduce equipment failures and unplanned downtime. The availability rate increased from 70.4% to 85.2%, closing 91.7% of the performance gap toward the 90% target. Additionally, MTBF improved from 3.2 to 6.8 h, and MTTR decreased from 28 to 15 min, confirming increased equipment reliability and faster recovery. The number of unplanned shutdowns due to autoclave pressure failures decreased by 45%, while sealing mechanism malfunctions were reduced by 38%. These improvements demonstrate the effectiveness of the TPM plan in addressing the main sources of downtime and stabilizing the production system. Similar results were reported by Pinto et al. [9], who implemented a strategic TPM-based maintenance plan that reduced lathe breakdowns by 23% and machining center failures by 38%, while also improving OEE by 5%. Although the investment for this component was modest (USD 840), it is projected to save over USD 3,000 annually in lost production time.
Finally, it focused on defect reduction and error prevention. Root causes of defects, particularly in the sealing and thermal treatment stages, were identified and addressed through standard operating procedures and operator training. The defect rate decreased from 13% to 4.3%, representing a 50% reduction in defective units. This result supports Nakajima’s argument that empowering operators in maintenance and quality assurance directly improves process reliability [10]. No significant equipment investments were required for this component, as improvements were achieved through non-monetary actions such as routine inspections and quality control checkpoints.
Despite the positive results, the study faced two main limitations: the lack of detailed historical operational data and the inability to conduct physical pilot testing due to real-time production constraints. Future research could address these limitations by performing on-site implementation trials or by using simulation platforms that model human variability and behavioral factors more realistically. Nevertheless, this study demonstrates that Lean Manufacturing tools, when adapted to the context of small-scale fish processors in Peru, can deliver measurable improvements in productivity, equipment performance, and product quality. These findings contribute valuable insights to both academic research and industrial application.
The implementation of Lean Manufacturing tools—specifically SMED and TPM—resulted in a significant improvement in the operational efficiency of the fish canning plant under study. The simulation demonstrated a 59% reduction in setup time and a 17% increase in productivity per batch, confirming the potential of SMED to streamline changeover processes and eliminate non-value- adding activities. These findings are consistent with the study by Monteiro et al. [6], who reported setup time reductions of 57% through the implementation of the SMED lean manufacturing tool.
In addition to time efficiency, the structured implementation of TPM led to notable gains in equipment performance. The increased MTBF and reduced MTTR reflect a more reliable and resilient maintenance system. These improvements are consistent with the outcomes reported by Campoverde-Pillajo et al. [11], who highlighted the benefits of autonomous maintenance and operator involvement in reducing process variability and machine downtime in a plastics extrusion line.
Furthermore, the model achieved a 49.5% reduction in defective units, improving both product quality and process stability. These results demonstrate how Lean tools can be effectively implemented in small-scale manufacturing contexts, even with limited resources. As shown in the study by Canahua [12] and Hu et al. [13], the application of TPM and SMED strategies in Peruvian SMEs contributes to increasing OEE and fostering a culture of continuous improvement across the production system.
- References
[1] Ministerio de la Producción, “Anuario estadístico pesquero y acuícola 2024 [2024 Fisheries and aquaculture statistical yearbook],” Lima, Peru, 2024. [Online]. Available: https://www.producempresarial.pe/anuario-estadistico-pesquero-y-acuicola-2024/
[2] E. F. Chavesta-Ayasta, D. Quispe-Victorio, y E. M. Avalos-Ortecho, "Application of lean manufacturing to increase productivity in a food sector company," in Proc. 23rd LACCEI International Multi-Conference for Engineering, Education, and Technology: "Engineering, Artificial Intelligence, and Sustainable Technologies in service of society", Mexico City, Mexico, Jul. 16-18, 2025. https://doi.org/10.18687/LACCEI2025.1.1.528
[3] G. Pinto, F.J.G. Silva, A. Baptista, Nuno O. Fernandes, R. Casais, C. Carvalho (2020) TPM implementation and maintenance strategic plan – a case study. Procedia Manufacturing. 51. p 1423-1430, doi: 10.1016/j.promfg.2020.10.198
[4] N. M. Canahua Apaza, “Implementación de la metodología TPM-Lean Manufacturing para mejorar la eficiencia general de los equipos (OEE) en la producción de repuestos en una empresa metalmecánica [Implementation of the TPM–Lean Manufacturing methodology to improve overall equipment effectiveness (OEE) in spare parts production in a metalworking company],” Ind. Data, vol. 24, no. 1, pp. 49-76, Aug. 2021, doi: 10.15381/idata.v24i1.18402.
[5] R. Hernández-Sampieri, C. Fernández Collado, and P. Baptista Lucio, Metodología de la investigación [Research Methodology], 6th ed. México, D.F., México: McGraw-Hill Interamericana, 2014.
[6] C. Monteiro, L. P. Ferreira, N. O. Fernandes, J. C. Sá, M. T. Ribeiro, and F. J. G. Silve, “Improving the machining process of the metalworking industry using the lean tool SMED,” Proc. Manuf., vol. 41, pp. 555-562, Mar. 2020, doi: 10.1016/j.promfg.2019.09.043.
[7] S. Shingo, A Revolution in Manufacturing: The SMED System, 1st ed. New York, NY, USA: Routledge, 1985.
[8] J. Arboleda Zúñiga and F. Rubiano del Chiaro, “Modelo propuesto para la implementación de la metodología SMED en una empresa de alimentos de Santiago de Cali [Proposed model for the implementation of the SMED methodology in a food company in Santiago de Cali],” Rev. Investig., vol. 10, no. 2, pp. 103–117, Jul. 2017, doi: 10.29097/2011-639X.85.
[9] G. Pinto, F. J. G. Silva, A. Baptista, N. O. Fernandes, R. Casais, and C. Carvalho, “TPM implementation and maintenance strategic plan – a case study,” Proc. Manuf., vol. 51, pp. 1423-1430, Nov. 2020, doi: 10.1016/j.promfg.2020.10.198
[10] S. Nakajima, Introduction to TPM: Total Productive Maintenance. Cambridge, MA, USA: Productivity Press, 1988.
[11] C. D. Campoverde-Pillajo, P. G. Noboa-Romero, E. J. Toala-Guananga, N.-J. Plúa-Triviño, and M. J. Tapay-Mendoza, “Implementación del Mantenimiento Productivo Total en Extrusora Starex 1600 para reducir paradas y variaciones [Implementation of Total Productive Maintenance on a Starex 1600 extruder to reduce stoppages and variability],” J. Econ. Soc. Sci. Res., vol. 4, no. 4, pp. 187–214, Oct. 2024, doi: 10.55813/gaea/jessr/v4/n4/141.
[12] N. M. Canahua Apaza, “Implementación de la metodología TPM–Lean Manufacturing para mejorar la eficiencia general de los equipos (OEE) en la producción de repuestos en una empresa metalmecánica [Implementation of the TPM–Lean Manufacturing methodology to improve overall equipment effectiveness (OEE) in spare parts production in a metalworking company],” Ind. Data, vol. 24, no. 1, pp. 49–76, Aug. 2021, doi: 10.15381/idata.v24i1.18402.
[13] Q. Hu, R. Mason, S. J. Williams, and P. Found, “Lean implementation within SMEs: A literature review,” J. Manuf. Technol. Manag., vol. 26, no. 7, pp. 980–1012, Sep. 2015, doi: 10.1108/JMTM-02-2014-0013.