Nonlinear Regression Based Predictive
Maintenance Framework to Reduce
Unplanned Downtime in a Fishmeal Plant
Diego A. La Torre Villegas1 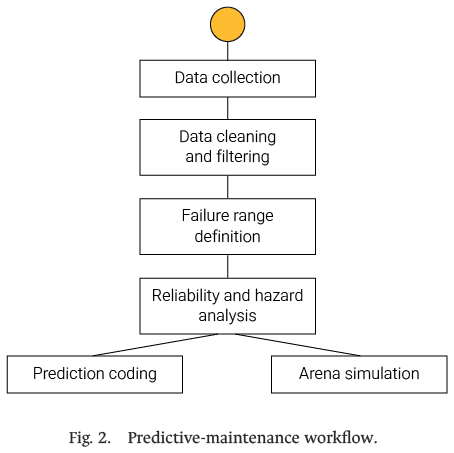 ,Gabriel E. Nores Quispe2 , Silvia P. Ponce Álvarez3
1[email protected], 2[email protected], 3[email protected]
123Carrera de Ingeniería Industrial, Universidad de Lima, Perú
Received: August 14, 2025 / Accepted: September 19, 2025 / Published: 5 June, 2026
doi: https://doi.org/10.26439/ciii2025.8643
Abstract—The fishing industry operates under demanding conditions in which limited and inconsistent machinery records often result in reactive maintenance strategies and unplanned downtime. This study proposes a predictive maintenance (PdM) framework for a fishmeal plant in Callao, Peru, integrating Lean principles with reliability modeling based on nonlinear regression to generate actionable maintenance planning inputs. The framework was embedded in discrete-event simulations using Arena, through which a 50% reduction in unplanned downtime and a 20% increase in equipment uptime were estimated compared with the baseline scenario. These results highlight the operational benefits of a reliability-driven planning approach and demonstrate that structured and validated maintenance records can significantly improve equipment availability and operational efficiency in fishmeal processing plants.
Index Terms—Fishmeal industry, predictive maintenance, reliability modeling, scheduling threshold.
- Introduction
Over the last decade, industrial digitalization and the Industrial Internet of Things (IIoT) have enabled continuous condition monitoring and accelerated the adoption of Predictive Maintenance (PdM) across sectors. Contemporary PdM systems integrate sensor networks with edge- and cloud-based analytics and artificial intelligence (AI) models to optimize maintenance scheduling and reduce unplanned downtime [1], [2].
Despite these advances, recurrent implementation barriers persist—particularly those related to data quality, transmission latency, and model interpretability [1], [13]. Under such constraints, log-based prognostic models offer a practical and immediately deployable first stage for facilities where full sensorization is cost-prohibitive or must be implemented incrementally, enabling measurable operational improvements while a phased IoT rollout is planned [1], [2].
PdM differs fundamentally from preventive maintenance. Preventive strategies rely on average service-life statistics for a given asset class to schedule interventions, whereas PdM determines maintenance timing based on the actual condition of each individual asset [3]. This condition-based approach supports informed decisions on whether to repair, replace, or defer intervention according to asset health [3]. In contrast, corrective maintenance is performed only after a failure occurs, typically resulting in higher costs and extended downtime [4].
Adopting a PdM framework represents a shift in organizational perspective, whereby maintenance is no longer viewed solely as a necessary cost but rather as a strategic function that adds measurable value [5]. Effective management of physical assets contributes directly to competitiveness, operational safety, and environmental performance [6]. Multiple review and survey studies report that structured preventive and PdM approaches lead to measurable improvements in maintenance costs, equipment availability, and asset longevity; however, the magnitude depends strongly on asset criticality, data quality, and deployment maturity [1], [2]. In this context, PdM tools—such as nonlinear regression—provide the capability to develop degradation models that estimate the remaining useful life (RUL) of equipment [2].
In the fishing industry, operations must withstand harsh marine conditions while maintaining continuous production. These conditions accelerate equipment wear and complicate maintenance planning. The lack of standardized and complete equipment records frequently leads to emergency repairs, unplanned downtime, and reduced productivity. Consequently, implementing PdM strategies tailored to the sector’s operational characteristics has become a strategic priority [7].
This research addresses that priority by integrating lean-inspired operational improvements with nonlinear regression models to forecast failures in industrial assets. While prior literature has extensively reviewed PdM algorithms and Remaining Useful Life (RUL) modeling in manufacturing contexts [2], only a limited number of studies have applied exponential-decay–based nonlinear regression specifically to fault prediction in fishmeal plants. Recent publications tend to emphasize broad Artificial Intelligence (AI) and Prognostics and Health Management (PHM) trends, leaving this application domain comparatively underexplored [7], [8], [9].
The general objective of this study is to design and validate a PdM model based on exponential-decay nonlinear regression, trained using historical maintenance records from a Peruvian fishmeal plant, and to assess its operational impact through discrete-event simulation. The specific objectives are as follows: (i) to structure and preprocess failure-time data collected between 2020 and 2024; (ii) to estimate reliability functions and analyze hazard-rate behavior; (iii) to train and validate the proposed model, reporting performance metrics such as Mean Absolute Error (MAE), Root Mean Square Error (RMSE), and the coefficient of determination (R²); and (iv) to simulate both current and improved operational scenarios in order to quantify changes in time in system, equipment uptime, and unplanned downtime.
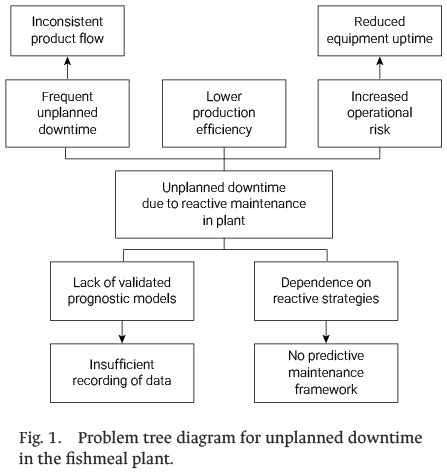
To contextualize these objectives, a problem-tree diagram was developed to represent the central issue of unplanned downtime in the fishmeal plant. The diagram identifies the underlying causes—such as insufficient machinery data recording and reliance on reactive maintenance strategies—as well as the resulting operational impacts on equipment uptime, production efficiency, and operational risk. Fig. 1 provides a structured foundation for the methodological framework presented in the following section.
Section II introduces the methodological framework, including data collection procedures, equipment selection criteria, and simulation parameters. Section III reports the validation results and compares the evaluated scenarios. Section IV discusses the operational implications, and Section V concludes the paper with the main findings and directions for future research.
- Methodology
This research was conducted in a fishing company located at the Port of Callao, Peru, with a focus on the fishmeal production process. The methodological framework, illustrated in Fig. 2, was designed to ensure the validity of the nonlinear regression procedure and the reliability of the data employed. This structured approach guided the development of the PdM model, enabling results that are both consistent and replicable.
The data preparation process was carried out in three main stages: extraction of maintenance records, calculation of the time-to-failure values for each machine, and organization of the information into a clean, structured dataset ready for modeling. This workflow ensured temporal consistency and facilitated robust model evaluation. Fig. 2 was adapted from Abbasi et al. [1].
A detailed dataset covering the period 2020–2024 was compiled from company records. The dataset comprised corrective maintenance logs along with specific information on equipment and processes. From an initial list of 66 items, 16 equipment–process combinations linked to 9 critical machines in fishmeal production were selected based on the following criteria:
- Availability of complete maintenance data records.
- Inclusion of relevant information for the year 2022.
- Presence of observable trends in the maintenance history.
- Exclusion of cases without a valid basis for comparative analysis.
- Exclusion of data with zero calculated reliability.
The Mean Time Between Failures (MTBF) was initially calculated for 28 pieces of equipment, with emphasis on those exhibiting the highest failure rates. Based on these selection criteria, the 16 most representative assets were chosen for detailed analysis. Identifying the system’s failure range and detecting maintenance patterns is essential for developing efficient predictive models and planning preventive maintenance.
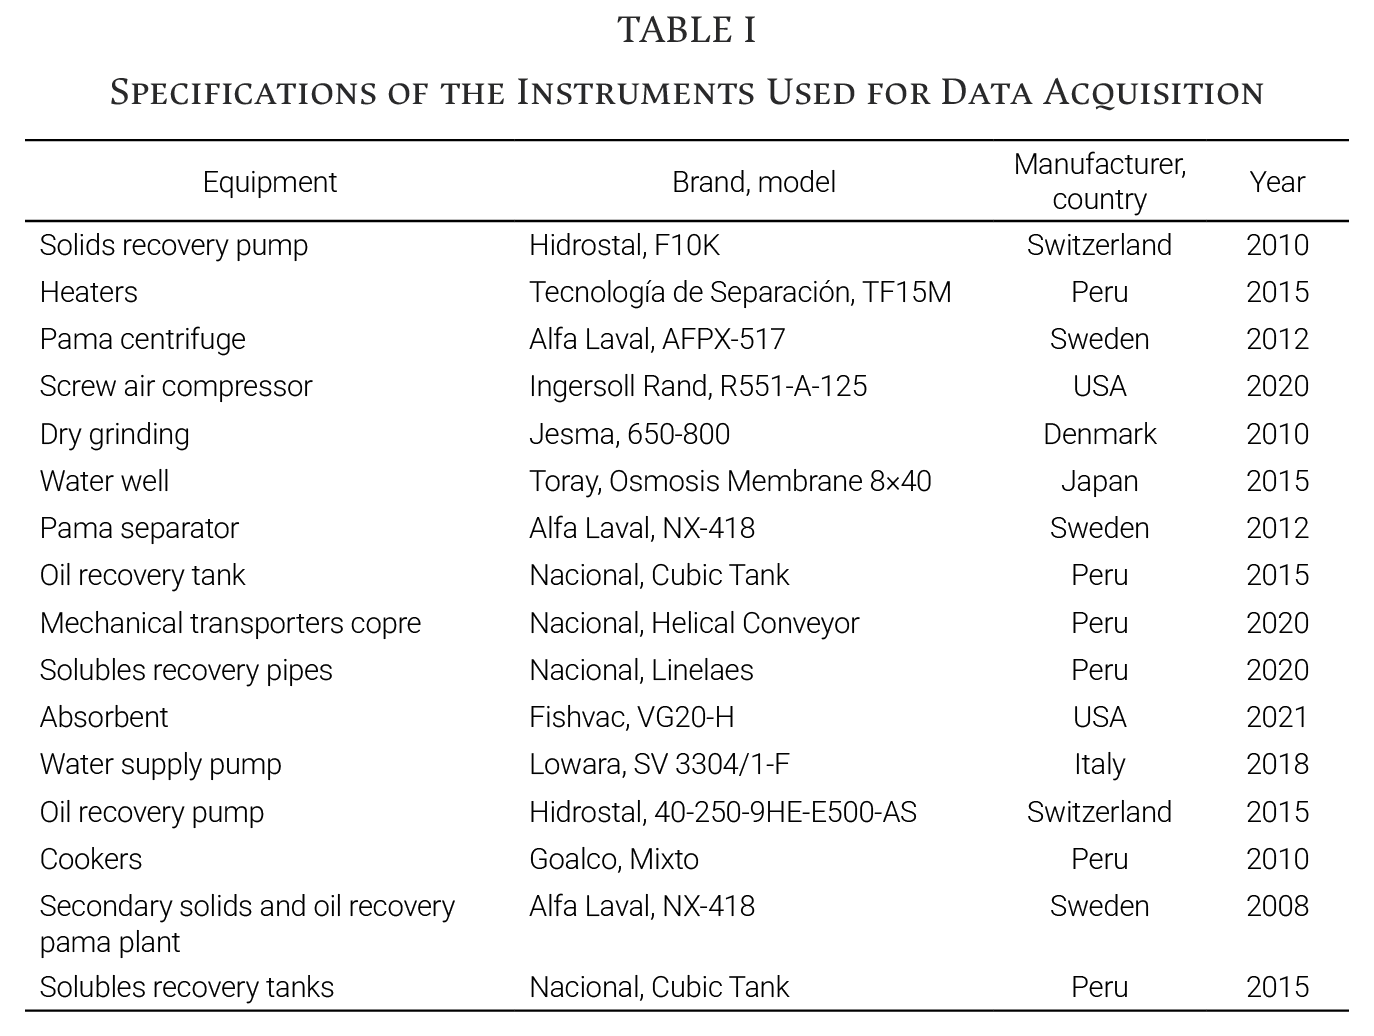
To guarantee data accuracy and reproducibility, all equipment used in this study was fully characterized in terms of manufacturer, model, year of manufacture, operating principle, calibration status, and the type of data collected.
The selected equipment encompassed sixteen units distributed across the main subsystems of the fishmeal plant, including pumps, centrifuges, compressors, separators, cookers, storage tanks, and auxiliary devices. Their operating principles ranged from centrifugal pumping and mechanical separation to heat transfer, pneumatic compression, and solid–liquid decantation. This diversity ensured a comprehensive representation of the plant’s operational chain for predictive modeling purposes.
The detailed specifications of each instrument are summarized in Table I.
All equipment was used to collect downtime data extracted from plant maintenance records. Most assets underwent semiannual maintenance, while heaters and cookers were additionally calibrated using thermometers in accordance with the manufacturer’s guidelines. The cooker thermometer (Certification Code: 1AT-0835-2025) and the heater thermometer (Certification Code: 1AT-0838-2025) hold valid calibration certificates.
A total of 16 critical machines were considered in the study; however, only 15 exhibited sufficient failure history (≥2 events) to enable the computation of time-to-failure intervals, yielding 125 usable failure events. The remaining machine was retained for descriptive analyses but excluded from quantitative validation metrics.
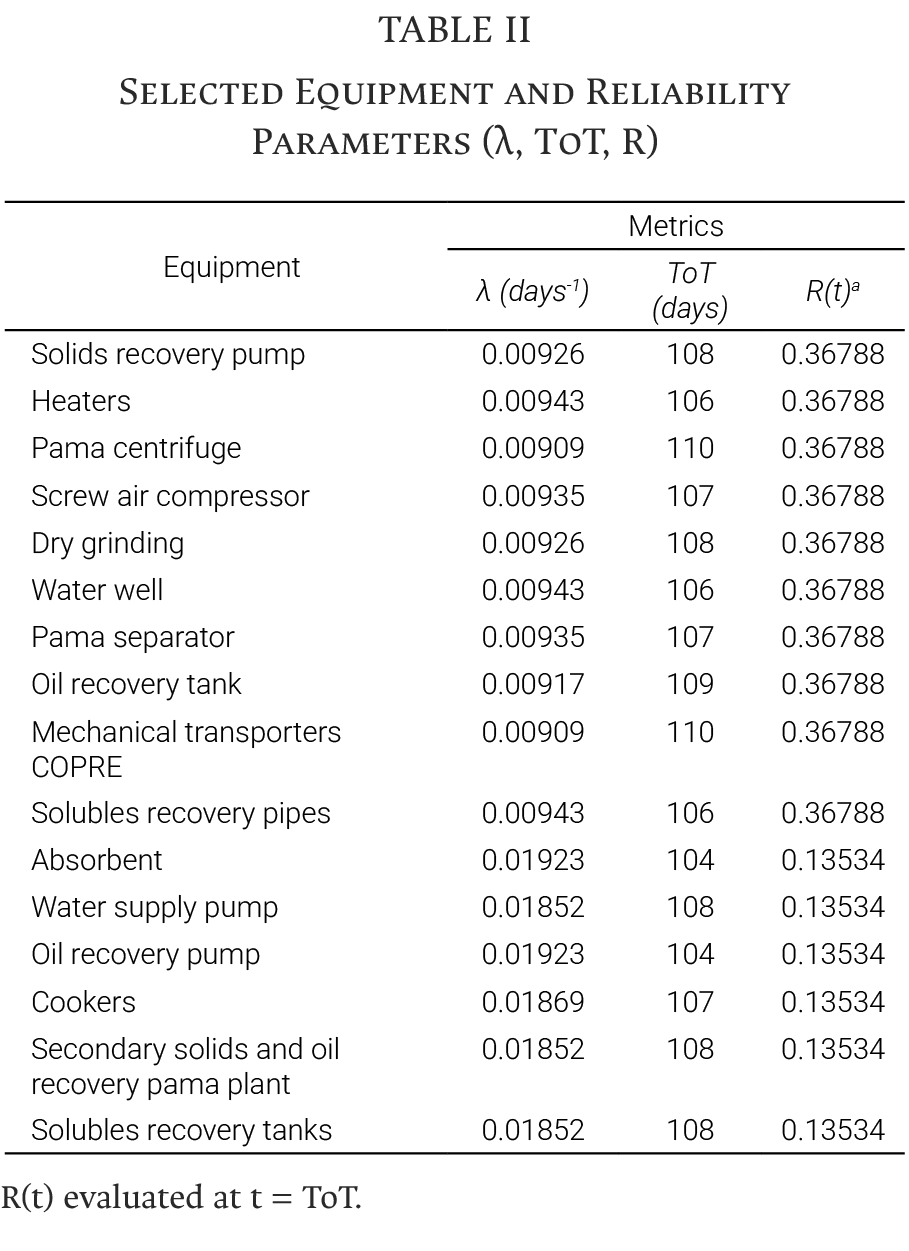
These criteria ensured data consistency and representativeness, enabling accurate analysis during the development of the predictive system. The final dataset was structured to include key indicators for the selected equipment, including failure rate, total operating time and reliability. These parameters provide the necessary data to evaluate system behavior and validate the predictive model under real operating conditions. The selected equipment and their associated parameter values are shown in Table II.
Arena version 16.1_x64 was employed to validate the improvements by simulating industrial processes, comparing real and improved scenarios to assess the impact of PdM. The simulation replicated operating conditions and maintenance patterns of the fishing plant using historical data to evaluate alternative maintenance strategies [10]. The average time in system, obtained from 100 simulation replications, was computed directly from the empirical outputs, thereby avoiding parametric assumptions in the comparison of scenarios.
We adopt the one-parameter exponential reliability model R(t) = exp (−λt), a parsimonious formulation well suited to maintenance-log datasets characterized by sparse failure events and limited covariates. In the broader RUL landscape, recent surveys place exponential-type models as a practical compromise between interpretability and predictive capability when continuous sensor streams are absent or incomplete [11]. In this setting, λ (day-1) is directly interpretable as the failure rate and enables scheduling through the median reliability threshold t50 = ln (2) / λ.
R(t) = exp (−λt) (1)
We estimate λ by Maximum Likelihood (MLE) from Time-to-Failure (TTF, days): (i) global and (ii) per-machine. For robustness, we also use leave-one-out (LOO) per machine, re-estimating λ without the held-out event before predicting t50. Validation compares predicted t50 against observed TTF using MAE, RMSE, and R2 (all in days). We describe the framework as nonlinear regression–based because the relationship between reliability and time is nonlinear; while constrained nonlinear curve fits were used for plotting; all reported estimates and metrics rely on MLE for λ.
Parameter estimation and coding were handled in Google Colab (NumPy/pandas/Matplotlib). Constrained nonlinear curve fits of the exponential form (intercept fixed at 1, functionally equivalent to (1) were used only for figure generation; validation metrics rely on MLE.
The analysis was conducted under two different scenarios:
- The real scenario, which considers the current limitations of the plant measured by the company.
- A proposed improvement based on recent research, such as that conducted by Deloitte Analytics Institute [12].
- To validate the impact of the PdM model, the simulation included:
- Arrival rate: 1 entity per day (representing processed anchovy)
- Service distributions: set in Arena Input Analyzer with average improvement times (VA Time).
- Maintenance: modeled as scheduled outages based on times adjusted to the selected distribution
- Simulation horizon: 111 days of operation in 2022
- Entities: 1 per day (due to version limitations)
- Replications: 100 runs per scenario to ensure statistical stability
- Results
The first step consisted of simulating the plant’s operational processes using Arena software [10] to establish a baseline for comparison and to assess the effectiveness of the proposed improvements. Prior studies have shown that discrete-event simulation can optimize preventive maintenance frequency, thereby avoiding unnecessary interventions and associated costs [13].
A. Model Validation Notes
Ground truth was TTF in days, computed per machine as entry date minus end-of-repair of the previous order (first records excluded). We report micro-averages over events. All λ values are in day⁻¹ and error metrics (MAE, RMSE) are reported in days.
B. LOO Protocol
For each event, λ was estimated excluding that event before predicting t50 = ln (2) / λ for the held-out record. This cross-validation reduces optimistic bias and approximates out-of-sample performance; studies support LOOCV in engineering reliability modeling and discuss when group/block CV may be preferable [14]–[15].
Industrial implementations that integrate predictive models into workflows (alerts, work orders, scheduling) report comparable availability improvements. Case studies in the automotive sector report reductions in unplanned stops when predictive models are integrated into routine operations [16], [17].
C. Predictive Model Performance
The model estimates t50 = ln (2) / λ where R(t) 0.5 as a planning cue. Validation against 2022 field records from the Callao plant—covering 125 failure events across 16 machines—is summarized in Table III.
TABLE III
Validation of the Predictor Against Field Time-to-Failure (TTF)
|
λ estimation strategy |
MAE (days) |
RMSE (days) |
R2 |
|---|---|---|---|
|
Global λ (MLE) |
26.59 |
38.64 |
-0.07 |
|
Per-machine λ (MLE) |
19.37 |
28.73 |
0.41 |
|
Per-machine λ (LOO) |
22.04 |
33.06 |
0.22 |
The results reported in Table III indicate that the modeling strategy significantly affects predictive accuracy. The global λ approach yields R2 = -0.07, indicating poor fit. In contrast, per-machine λ (MLE) achieves R2 = 0.41, confirming that individual machine modeling captures distinct degradation patterns more effectively. The LOO validation (R2 = 0.22) supports robustness. These findings justify the adoption of per-machine modeling in the subsequent analysis.
D. Reliability Curve
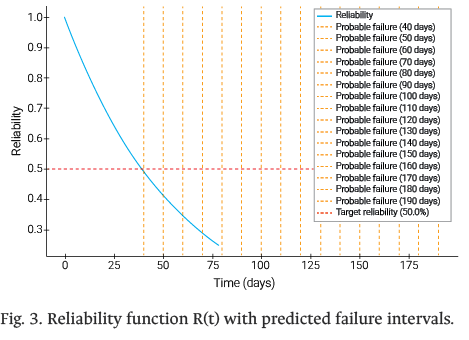
For nonspecialist readers, Fig. 3 illustrates the reliability function R(t) = exp(−λt) together with threshold markers t50 = ln (2) / λ. This graphical representation highlights the time at which reliability crosses a critical threshold (e.g., 50%), guiding preventive interventions and maintenance scheduling, rather than predicting exact failure times [18]. The exponential decay reflects the constant-hazard assumption underlying the model.
The calculated curve corresponds to the 2022 baseline scenario, and incorporates existing downtime patterns observed in plant operations. It enables operators to anticipate when the probability of failure reaches a critical threshold and to schedule maintenance interventions accordingly, optimizing resource allocation and minimizing unplanned stops.
The reliability curves in Fig. 3 display distinct decay rates for different equipment categories, consistent with the failure rate parameters (λ) reported in Table II. Equipment with higher λ values (e.g., Absorbent, Cookers) exhibit steeper reliability decline and shorter t₅₀ intervals, requiring more frequent maintenance windows. Conversely, equipment with lower λ values exhibits slower degradation, allowing longer intervals between interventions. This differentiation supports prioritized allocation of maintenance resources toward more critical assets.
The choice of an exponential reliability model is grounded in established prognostics literature. Single-parameter exponential models are widely adopted for industrial assets under constant-hazard assumptions and when covariate data are limited [19], [20]. While more sophisticated degradation models incorporating multiple failure modes and time-varying hazards exist, they require extensive sensor infrastructure and computational resources often unavailable in resource-constrained industrial settings. Recent comprehensive reviews of RUL estimation methods confirm that exponential-type models represent a practical compromise between predictive capability and operational simplicity, particularly for log-based PdM applications in marine and food-processing industries [11]. This pragmatic approach has been successfully validated in similar industrial contexts [16], [17].
The model was designed to replicate the plant’s current operating conditions as realistically as possible, by incorporating actual equipment specifications, maintenance schedules, and observed failure patterns. The proposed improvements in the second scenario are based on recent industry research and benchmarking studies [12], which identify targeted modifications to critical process steps and equipment configurations aimed at enhancing overall system reliability and throughput.
E. Operational Outcomes
The PdM strategy was associated with an estimated 50% reduction in downtime (95% CI: [45%, 55%]) and a 20% increase in uptime (95% CI: [18%, 22%]) relative to the baseline scenario. These confidence intervals were derived from the empirical distribution of 100 simulation replications, confirming the statistical significance of the observed improvements. The magnitude of these effects falls within the upper range of impacts reported in prior PdM studies [8], [9]. Although the analysis is limited to a single plant and one year of records, the proposed approach is transferable to other facilities with comparable operations, provided that maintenance logs are complete and standardized.
F. Scenario Comparison
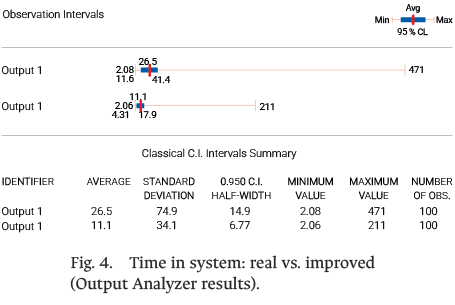
All times in this section are reported in hours, consistent with the output format of the Arena simulation tool. The simulation compared two operational scenarios over a 111-day horizon using 100 independent replications to ensure statistical robustness. Fig. 4 displays the comparative results from the Arena Output Analyzer, contrasting the baseline (“real”) scenario—reflecting current plant operations with reactive maintenance practices—against the proposed (“improved”) scenario incorporating the PdM framework. The boxplots illustrate the distribution of time in system across all replications for both scenarios. In the baseline (real) scenario, the mean time in system was 26.5 h, whereas in the improved scenario it dropped to 11.1 h, representing a 58% reduction and indicating substantial improvement in processing performance.
G. Simulation Outputs
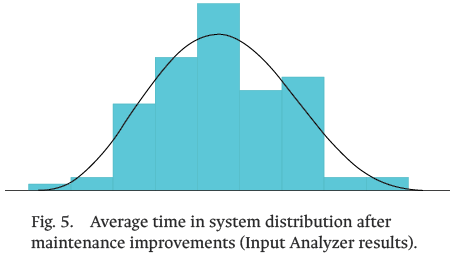
To characterize performance under the improved strategy, the distribution of the average time in system per replication was analyzed. Fig. 5 displays the empirical distribution derived from the Arena Input Analyzer for the improved scenario. All times are reported in hours, consistent with the output of the Arena simulation tool. The histogram shows the frequency distribution of average processing times across the 100 independent simulation runs, providing quantitative insight into both the variability and central tendency of system performance under the proposed PdM approach.
The distribution exhibits substantially reduced dispersion compared to the baseline scenario. Most replications cluster around the 11 h, with a visibly tighter spread than that observed in the baseline runs. This concentration of values around the central tendency confirms more predictable and stable operations under the proposed PdM framework. The reduced variability indicates that maintenance interventions are better synchronized with actual equipment degradation patterns, minimizing both premature maintenance actions and unexpected failures.
This operational stability is particularly valuable in the fishing industry, where production windows are constrained by seasonal catch availability and processing capacity must be maximized during active fishing periods.
The tighter distribution further implies reduced uncertainty in production planning, enabling more accurate scheduling of downstream operations such as packaging, storage, and logistics. Moreover, more consistent processing times facilitate improved coordination with vessel arrival schedules and raw material handling, ultimately reducing waste and improving overall supply chain efficiency in the perishable seafood sector.
The narrowing of dispersion in the improved scenario (e.g., tighter P25–P75 ranges shown in Fig. 4) indicates more predictable operations. The 95% confidence intervals for downtime and uptime were computed directly from the empirical distribution of simulation replications, supporting the statistical significance of the gains reported above. No parametric distributional assumptions were imposed; instead, statistical comparisons across scenarios relied on the empirical replication outputs, ensuring robust inference that is not sensitive to potentially violated parametric assumptions. This nonparametric approach is particularly appropriate given the discrete-event nature of the simulation and the finite sample size.
- Discussion
A. Improved Efficiency
The analysis shows a substantial efficiency gain after implementing the predictive-maintenance strategy: the mean time in system decreased from 26.5 h to 11.1 h, indicating a marked improvement in overall processing performance. The magnitude of this reduction places our results at the upper end—or above—the range commonly reported in the predictive-maintenance literature, where industrial applications typically document efficiency gains of approximately 20–30% [9], [21]. Larger improvements have been reported when interventions are broader in scope or more tightly aligned with operational constraints and process characteristics [8], [12].
Our findings are consistent with reviews that frame PdM as the joint use of sensing and analytics to optimize intervention timing and reduce unplanned stops, while also highlighting persistent adoption challenges—such as data quality, volume and latency, model transferability, and organizational readiness—that often determine whether sensor-based or log-based strategies are preferable in a given plant context [2]. In settings where IIoT deployment is partial or phased, log-based reliability models—such as the exponential-decay model adopted in this study—can deliver immediate operational benefits while a staged sensor strategy is implemented.
Choosing an exponential-decay model is appropriate for industrial assets under constant-hazard assumptions and in contexts with sparse covariate information [19], [20]. Rather than predicting exact failure times, the model estimates a planning threshold t50 = ln (2) / λ at which R(t) = 0.5. Its parameters are transparent and support maintenance decision rules and scheduling. In our case, the model’s predictive precision—supported by the MAE and RMSE values reported in the Results section (Table III)—provides actionable lead time for planning without inducing excessive preventive interventions.
Differences between our gains and ranges reported elsewhere can be attributed to plant-specific targeting of critical assets and maintenance windows as well as to the synergy between reliability modeling and discrete-event simulation, which likely amplified the observed effects. Additionally, heterogeneity in data depth, asset criticality, and organizational maintenance practices across studies may contribute to the variability reported [9], [21], [8], [12].
B. Operationalization and Integration
The practical value of predictive models depends on connecting predictions to maintenance workflows. In industrial deployments, this connection is achieved by integrating predictive outputs into IIoT-enabled pipelines, dashboards, and rule-based triggers that translate model signals into concrete actions (e.g., alerts, work orders, or dynamic rescheduling). A phased adoption approach is recommended: (i) deploy validated log-based models to prioritize critical assets; (ii) instrument the highest-priority equipment with targeted sensors; (iii) implement real-time edge/cloud data ingestion supported by a lightweight dashboard; and (iv) close the loop by measuring intervention effectiveness and retraining models. Field implementations report that such pipelines reduce unplanned stops when coupled with well-defined organizational processes [16], [17], while comprehensive reviews highlight data quality, latency, and model transferability as key adoption challenges [2].
C. Reduced Downtime
The data indicate an approximately 50% reduction in equipment downtime (95% CI: [45%, 55%]), which lies at the upper end of the 20–50% range reported in prior studies [9] and is consistent with reports of roughly 30% downtime reductions across diverse industrial sectors [21]. Variations in effect magnitude in magnitude across studies may reflect specific operating conditions and asset mixes, as well as data quality and maintenance practices.
D. Comparison and Analysis
Differences between our results and prior reports can be attributed to contextual factors and data practices. First, the model was calibrated on curated maintenance logs and tailored to a specific production flow, which can amplify benefits when bottlenecks concentrate on a few critical machines. Second, the alignment between reliability modelling (used to derive planning thresholds) and simulation of plant constraints likely contributed to the observed gains. At the same time, the literature underscores that effectiveness depends on data quality, availability, and organizational readiness [2].
For the simulation output—average time in system per replication—variability is characterized directly from the empirical distribution across replications. This approach supports uncertainty analysis and scenario comparison without imposing a parametric distributional family.
E. Limitations and Future Work
Although the results are promising, several limitations should be noted. The analysis is based on historical data from a single plant and a single year, which limits long-term trend capture and external validity. In addition, the absence of real-time sensor data reduces the temporal resolution of failure prediction, and data gaps required careful preprocessing.
The exponential-decay reliability model represents a parsimonious choice under constant-hazard assumptions and sparse covariates [19], [20]. Future work should (i) integrate IIoT-based monitoring to collect real-time signals, (ii) develop interactive dashboards to operationalize decision support, and (iii) explore hybrid reliability-machine-learning approaches to enhance accuracy and transparency. Extending the dataset across multiple years and facilities with similar processes would strengthen validation of the proposed approach [1], [2].
- Conclusions
This study shows that PdM can be effectively implemented using historical maintenance and failure logs—without continuous sensor data—by estimating planning thresholds rather than exact failure times. We used an exponential-decay reliability model to predict the time t50 = ln(2) / λ at which reliability falls to 0.5; the model was calibrated with plant logs and validated on the 2022 dataset. In this context, the per-machine calibration of 𝜆 delivered actionable lead time for scheduling preventive work (see Results, Table III), consistent with the model’s intended role as a decision cue for defining maintenance windows.
When paired with discrete-event simulation, the approach translated into measurable operational gains. In the improved scenario, the mean time in system decreased from 26.5 h to 11.1 h, downtime was reduced by approximately 50% (95% CI: [45%, 55%]), and uptime increased by roughly 20% (95% CI: [18%, 22%]). These results confirm that well-structured and standardized maintenance logs can provide a robust foundation for predictive strategies that enhance equipment availability and overall process performance.
For successful adoption, organizations should establish rigorous and consistent data-recording protocols to ensure data completeness and traceability. As data maturity increases, the integration of IIoT data streams and complementary analytical methods can further enhance real-time decision-making and support a phased transition from reactive maintenance to PdM. Recent studies report reference architectures and platforms that streamline IIoT-based predictive maintenance deployment [22], providing practical pathways for staged digital integration.
References
[1] M. Achouch et al., “On predictive maintenance in Industry 4.0: Overview, models, and challenges,” Appl. Sci., vol. 12, no. 16, p. 8081, Aug. 2022, doi: https://doi.org/10.3390/app12168081
[2] P. Nunes, J. Santos, and E. Rocha, “Challenges in predictive maintenance – A review,” CIRP J. Manuf. Sci. Technol., vol. 40, pp. 53–67, Feb. 2023, doi: https://doi.org/10.1016/j.cirpj.2022.11.004
[3] R. B. Shetty, “Predictive maintenance in the IoT era,” in Prognostics and Health Management of Electronics: Fundamentals, Machine Learning, and the Internet of Things, Hoboken, NJ, USA: Wiley, 2018, ch. 21, pp. 589–612, doi: https://doi.org/10.1002/9781119515326.ch21
[4] A. Dogan and D. Birant, “Machine learning and data mining in manufacturing,” Expert Syst. Appl., vol. 166, p. 114060, Mar. 2021, doi: https://doi.org/10.1016/j.eswa.2020.114060
[5] S. T. March and G. D. Scudder, “Predictive maintenance: Strategic use of IT in manufacturing organizations,” Inf. Syst. Front., vol. 21, no. 2, pp. 327–341, Mar. 2017, doi: https://doi.org/10.1007/s10796-017-9749-z
[6] M. Molęda, B. Małysiak-Mrozek, W. Ding, V. Sunderam, and D. Mrozek, “From corrective to predictive maintenance—A review of maintenance approaches for the power industry,” Sensors, vol. 23, no. 13,
p. 5970, Jun. 2023, doi: https://doi.org/10.3390/s23135970
[7] A. S. Kalafatelis, N. Nomikos, A. Giannopoulos, and P. Trakadas, “A survey on predictive maintenance in the maritime industry using machine and federated learning,” 2024, TechRxiv:173473250.04784922.v1.
[8] A. Sahli, R. Evans, and A. Manohar, “Predictive maintenance in Industry 4.0: Current themes,” Procedia CIRP, vol. 104, pp. 1948–1953, Nov. 2021, doi: https://doi.org/10.1016/j.procir.2021.11.329
[9] A. Ucar, M. Karakose, and N. Kırımça, “Artificial intelligence for predictive maintenance applications: Key components, trustworthiness, and future trends,” Appl. Sci., vol. 14, no. 2, Art. no. 898, Jan. 2024, doi: https://doi.org/10.3390/app14020898
[10] R. R. Neeraj et al., “Modelling and simulation of discrete manufacturing industry,” Mater. Today: Proc., vol. 5, no. 11, pp. 24971–24983, Jan. 2018, doi: https://doi.org/10.1016/j.matpr.2018.10.298
[11] S. Kumar, K. K. Raj, M. Cirrincione, G. Cirrincione, V. Franzitta, and R. R. Kumar, “A comprehensive review of remaining useful life estimation approaches for rotating machinery,” Energies, vol. 17, no. 22, Art. no. 5538, Nov. 2024, doi: https://doi.org/10.3390/en17225538
[12] Deloitte Analytics Institute, “Predictive maintenance position paper,” Deloitte, London, U.K., 2017. Accessed: Aug. 15, 2025. [Online]. Available: https://www2.deloitte.com/content/dam/Deloitte/de/Documents/deloitte-analytics/Deloitte_Predictive-Maintenance_PositionPaper.pdf
[13] S. Vilarinho, I. Lopes, and J. A. Oliveira, “Preventive maintenance decisions through maintenance optimization models: A case study,” Procedia Manuf.,
vol. 11, pp. 1170–1177, Jan. 2017, doi: https://doi.org/10.1016/j.promfg.2017.07.241
[14] Y. Pang, Y. Wang, X. Lai, S. Zhang, P. Liang, and X. Song, “Enhanced Kriging leave-one-out cross-validation in improving model estimation and optimization,” Comput. Methods Appl. Mech. Eng., vol. 414, Art. no. 116194, Sep. 2023, doi: https://doi.org/10.1016/j.cma.2023.116194
[15] T. Zhou and Y. Peng, “An active-learning reliability method based on support vector regression and cross-validation,” Comput. Struct., vol. 276, Art. no. 106943, Feb. 2023, doi: https://doi.org/10.1016/j.compstruc.2022.106943
[16] S. Ayvaz and K. Alpay, “Predictive maintenance system for production lines in manufacturing: A machine learning approach using IoT data in real-time,” Expert Syst. Appl., vol. 173, Art. no. 114598, Jul. 2021, doi: https://doi.org/10.1016/j.eswa.2021.114598
[17] J. C. Oliveira Ojeda et al., “Application of a predictive model to reduce unplanned downtime in automotive industry production processes: A sustainability perspective,” Sustainability, vol. 17, no. 9, Art. no. 3926, Apr. 2025, doi: https://doi.org/10.3390/su17093926
[18] T. Abbasi, K. H. Lim, N. S. Rosli, I. Ismail, and R. Ibrahim, “Development of predictive maintenance interface using multiple linear regression,” in Proc. 2018 Int. Conf. Intell. Adv. Syst. (ICIAS), Kuala Lumpur, Malaysia, Aug. 2018, doi: https://doi.org/10.1109/ICIAS.2018.8540602
[19] K. C. Siju and M. Kumar, “Bayesian estimation of reliability using time-to-failure distribution of parametric degradation models,” J. Stat. Comput. Simul., vol. 88, no. 9, pp. 1717–1748, Mar. 2018, doi: https://doi.org/10.1080/00949655.2018.1445743
[20] S.-T. Tseng and I.-C. Lee, “Optimum allocation rule for accelerated degradation tests with a class of exponential-dispersion degradation models,” Technometrics, vol. 58, no. 2, pp. 244–254, Apr. 2016, doi: https://doi.org/10.1080/00401706.2015.1033109
[21] H. Mahfoud, O. Moutaoukil, M. T. Benchekroun, and A. Latif, “Real-time predictive maintenance-based process parameters: Towards an industrial sustainability improvement,” in Proc. Int. Conf. Adv. Intell. Syst. Sustain. Dev. (AI2SD’2023), pp. 18–34, Mar. 2024, doi: https://doi.org/10.1007/978-3-031-54288-6_3
[22] C. Resende et al., “TIP4.0: Industrial Internet of Things platform for predictive maintenance,” Sensors, vol. 21, no. 14, p. 4676, Jul. 2021, doi: https://doi.org/10.3390/s21144676