Dynamic Weighing Through
Vibration-Based Structural Monitoring
in a Prestressed Concrete Road Bridge
Jennifer Marcela López1 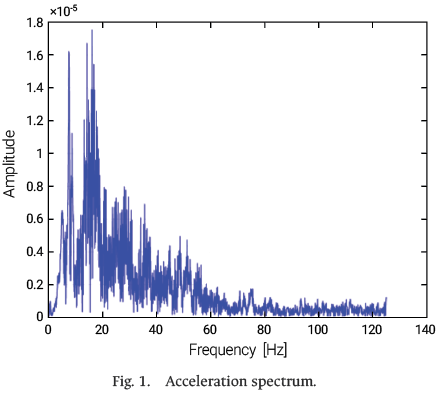 , Diana C. Millán2 , Mauricio Marín3 ,
Johannio Marulanda4 , Peter Thomson5
1 [email protected], 2 [email protected],
3 [email protected], 4 [email protected],
12345 Research Group in Seismic, Wind, Geotechnical, and Structural Engineering (G 7),
School of Civil and Geomatics Engineering, Universidad del Valle, Colombia.
Recibido: 20 Mayo 2025 / Publicado: 24 Abril 2026
https://doi.org/10.26439/ciic2025.8666
ABSTRACT. The aim of this study was to implement a vibration-based approach for non-invasive dynamic weighing of a deteriorated prestressed concrete bridge. The research is set within the current context of road infrastructure, which is increasingly impacted by the frequent passage of overloaded vehicles. The proposed methodology relies on the structural vibration response recorded by a monitoring system composed of accelerometers and strain gauges mounted directly on the bridge girders. While commercial Bridge Weigh-In-Motion (B-WIM) systems have demonstrated high accuracy in estimating Gross Vehicle Weight (GVW), their implementation is often constrained by the ideal structural conditions required for proper operation. Moreover, these systems rely primarily on strain measurements, which require more complex and costly instrumentation, particularly in long-span bridges. In contrast, the proposed methodology is based on vibration measurements, which can be obtained using more portable equipment that cover larger areas with fewer sensors. Through numerical simulations and experimental validation, the method achieved high accuracy in estimating both GVW (with errors below 5%) and axle weights (with errors below 10%). The results demonstrate that this methodology is an efficient tool for roadway load monitoring, contributing to the reduction of structural risks and the improvement of road infrastructure management.
KEYWORDS: Bridges, numerical model, structural health monitoring, technology, vehicle load, weigh in motion (WIM)
THEMATIC AXES: Seismic and structural engineering
- Introduction
Bridges are key components of road infrastructure networks, playing a critical role in regional connectivity and economic development. Ensuring their proper operation is essential, as they must withstand vehicular loads without compromising structural integrity or the safety of users. Accurately identifying these loads is crucial, as underestimating them can result in severe structural damage or even catastrophic failure. The collapse of a bridge results not only in the loss of human life but also in substantial economic consequences, including traffic disruptions, commercial losses, logistical delays, and high reconstruction costs. In the communities affected, the impact extends to reduced mobility and tourism, further amplifying the long-term economic burden.
Globally, multiple bridge collapses caused by overloading and structural deficiencies have underscored the importance of effective load control. For example, the Morandi Bridge in Genoa, Italy (2018), and the Nanfang’ao Bridge in Taiwan (2019) collapsed under heavy vehicular loads, resulting in significant fatalities and infrastructure losses [1], [2]. In Colombia, approximately 20 bridges have collapsed over the past decade, including recent cases such as the El Alambrado bridge (2023), the road bridge over the Charte River in Yopal, and the Guayepo bridge in 2016 [3]. These failures are largely attributed to overloading and deterioration, which have seriously impacted mobility and road safety [4]. A study conducted by the National University of Colombia reported over 13 bridge failures in 2023 alone, nearly 24.4% of which involved road bridges, with overloading identified as a major contributing factor [5]. Similarly, a 2011 study had already identified overload as a contributing factor in 7% of bridge failures [6].
The growing need for effective strategies to manage and monitor vehicular loads is justified by critical factors. These include road safety, given the risks posed by overloading, infrastructure preservation, as excessive loads reduce structural lifespan and increase maintenance costs, and regulatory compliance, which requires reliable tools to enforce legal weight limits. For example, an overload of just one metric ton (1 t) applied to a single axle can increase pavement damage by up to 92% [7]. In this context, collecting data such as GVW, axle loads, and axle spacing has become essential not only for safety assessments but also for fatigue analysis and load-carrying capacity evaluations.
Conventional load identification methods, such as static weigh stations, offer high accuracy but are costly, land-intensive, and often avoided [8], [9]. Their implementation is often impractical in urban or high-traffic areas. As an alternative, Weigh-In-Motion (WIM) systems enable dynamic estimation of vehicle weights without requiring vehicles to stop. These systems, however, still present certain limitations, including the need for pavement modifications, potential traffic disruptions, and the risk of introducing noise or bias into the data [9], [10]. An advanced alternative to WIM is the B-WIM system, which uses the bridge as a weighing scale to estimate axle loads. To achieve this goal, these systems aim to optimize the fit between a finite element model and the structure’s experimental response [11], [12], [13]. Based on the methodology proposed by Fred Moses in 1979 [14], B-WIM technology has evolved through modal analysis techniques and dynamic system modeling. Research efforts, including those by S. Law and Chan et al., introduced time-domain identification methods and addressed the dynamic effects of vehicle passage, thereby enhancing the accuracy of axle weight identification [15], [16], [17]. In Europe, the WAVE project significantly advanced the field by eliminating the need for pavement sensors [18]. More recently Yang Yu enhanced estimation accuracy by incorporating influence surfaces that account for a vehicle’s transverse position on the bridge [19]. B-WIM systems have now been implemented in more than 20 countries for traffic analysis, overload detection, and infrastructure planning [20], [21].
Despite their benefits, traditional B-WIM systems rely heavily on ideal structural conditions, limiting their applicability on deteriorated bridges. Structural defects, surface roughness, and approach geometry generate signal noise and present significant challenges for modeling accuracy [12]. Additionally, conventional B-WIM approaches typically are based on strain responses, which require the installation of strain gauges—sensors that are highly sensitive and must be positioned precisely so that vehicle axles pass directly over them to enable precise weight identification. Such an approach often requires a large number of sensors, thereby increasing system complexity and cost. By comparison, a vibration-based method provides enhanced practicality, as accelerometers can monitor broader areas with fewer devices, facilitating implementation on longer-span bridges. This work addresses these limitations by proposing a noninvasive, vibration-based B-WIM methodology applied to a deteriorated prestressed concrete bridge located in Cali, Colombia. By integrating structural monitoring data from accelerometers and strain gauges with numerical model calibration, the system estimates vehicle speed, axle loads, and GVW. This method is validated under real conditions and provides a practical solution for bridge load monitoring without traffic disruption or invasive interventions. The hypothesis is that, even in deteriorated structures, accurate dynamic weight estimations can be achieved through calibrated modeling and response monitoring, thereby contributing to safer and more sustainable infrastructure management.
- Methodology
In the process of estimating vehicular loads on bridges, vehicle identification is essential, requiring information such as speed, number of axles, and axle spacing. The accuracy of these data has a significant impact on the precision of the weight estimates [22]. For a vehicle weight estimation to be considered reliable, a complete identification of the vehicle is required, with a margin of error of less than 10% [23].
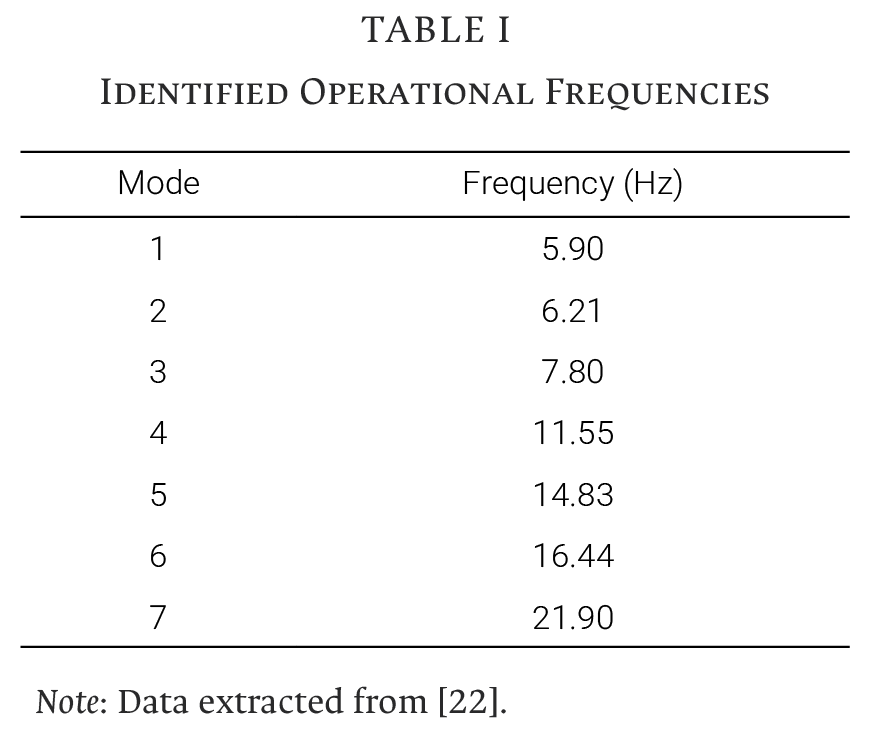
Vehicle identification was carried out using structural vibrations measured through the peak-to-peak method. A band-pass filter between 22 and 60 Hz was applied to the acceleration records to remove low- and high-frequency components. The frequency range limits were defined based on the dynamic properties of the structure, which were obtained through the Stochastic Subspace Identification (SSI) technique. The 22 Hz value corresponds to the highest frequency among the predominant modes identified experimentally as shown in Table I, while 60 Hz was set as the upper limit as frequencies above this threshold contribute minimally, as shown in the acceleration signal spectrum in Fig. 1. This filtering process effectively isolated the signal components generated by the passage of vehicle axles. Vehicle speed was calculated based on the time delay between the signal peaks corresponding to the vehicle’s entry and exit from the bridge [23]. Using this speed and the time intervals between the peaks produced by each axle, the axle spacing may be accurately calculated.
For load identification, based on Moses’ algorithm, the static weight of each axle is determined by solving (1). In this equation, A represents the weight per axle, and the sum of these axle weights yields the GVW.
 (1)
(1)
The terms of the equation are defined through the following expressions.
 (2)
(2)
 (3)
(3)
 (4)
(4)
Where ISi (k -Ci) represents the ordinate of the influence surface, constructed from a numerical model of the structure, at the position of the i-th axle at time instant k; Di corresponds to the distance between the first axle and the i-th axle; ƒ is the sampling frequency of the acquisition system, and v is the constant speed of the vehicle.
The influence surface was generated using the method proposed by O’Brien et al. [24], in which the model’s response to a truck load of known weight is expressed by (5). To reduce calculation errors, (6) is used to compare the measured response with the theoretical response.
 (5)
(5)
 (6)
(6)
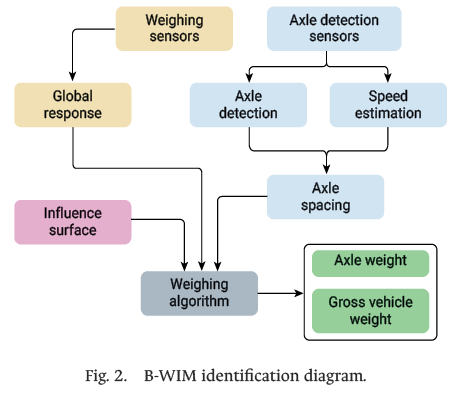
The general process for estimating vehicle weight is illustrated in Fig. 2, which considers three key factors: vehicle parameters, influence surface, and global bridge response. In this work, the global response is obtained by analyzing strain signals recorded by strain gauges installed on the beams at the bridge midspan, where the maximum response occurs during vehicle passage. These signals are compared with the influence surface obtained from the responses of the calibrated numerical bridge model, which accurately represents the structural behavior of the bridge. Using this information, together with vehicle identification, the dynamic weighing algorithm is applied to estimate the axle loads and GVW.
- Instrumented Bridge
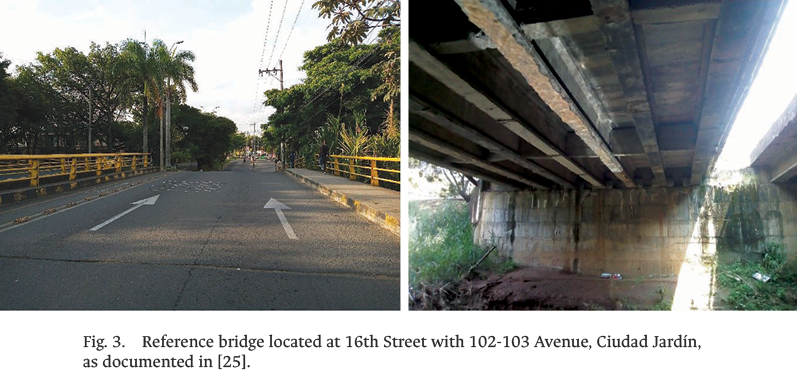
This study focuses on an instrumented bridge in Cali, Colombia, which exhibits significant deterioration in its riding surface and steep longitudinal gradient. The structure’s permanent instrumentation enabled continuous structural monitoring without disrupting traffic flow. The structure is located on the 16th Street, between Avenues 102 and 103, and serves north-south
traffic. Based on the information provided by local residents, the bridge was estimated to have been built in 1999. The structure consists of a deck with prefabricated concrete slabs, with two traffic lanes, an exclusive bicycle lane, and a pedestrian sidewalk. The superstructure consists of a system of seven prestressed concrete I-beams and two intermediate braces, as shown in Fig. 3.
A. Monitoring System and Data Transmission
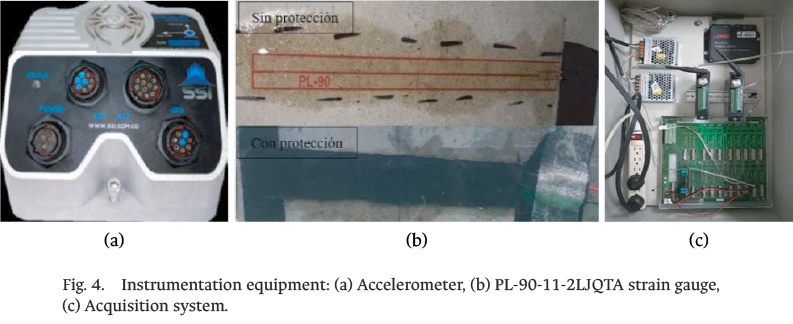
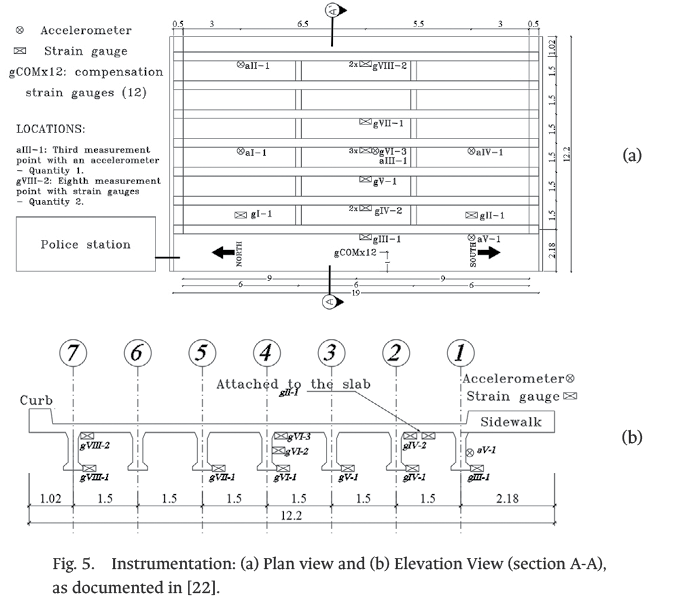
The permanent monitoring instrumentation installed on the bridge consists of five triaxial accelerometers and 24 strain gauges (12 for strain measurement and 12 for temperature compensation). These sensors enable the continuous recording of vibrations and deformations, respectively. The Waleker SMA-551 accelerometers have a nominal sensitivity of 1000 mV/g, can measure acceleration ranges of ±2 g and ±4 g, and feature a dynamic range greater than 90 dB within a frequency range of 0–250 Hz, as shown in Fig. 4(a). PL-90-11-2LJQTA strain gauges were selected for the concrete strain measurements. These sensors have a strain limit of 2% (20,000 × 10⁶ µε) and use a two-wire connection for power supply and data transmission. The strain gauges were bonded to the bridge surface and protected from environmental factors using three layers of protective coating, as shown in Fig. 4(b). The data acquisition and power system for the strain gauges consists of two LORD V-Link-200 nodes, each with eight channels—four configured for differential measurements and four for single-ended measurements. These nodes are equipped with an anti-aliasing filter and an 18-bit analog-to-digital conversion board as shown in Fig. 4(c).
The data collected by the accelerometers and strain gauges are transmitted via a gateway using UTP cables, which converge at an 8-port industrial switch, centralizing all information. From this switch, data are transmitted via a UTP cable to a computer located at the local police station, where they are stored and analyzed. The sensor distribution layout is shown in Fig. 5.
- Results and Analysis
A. Numerical Simulations
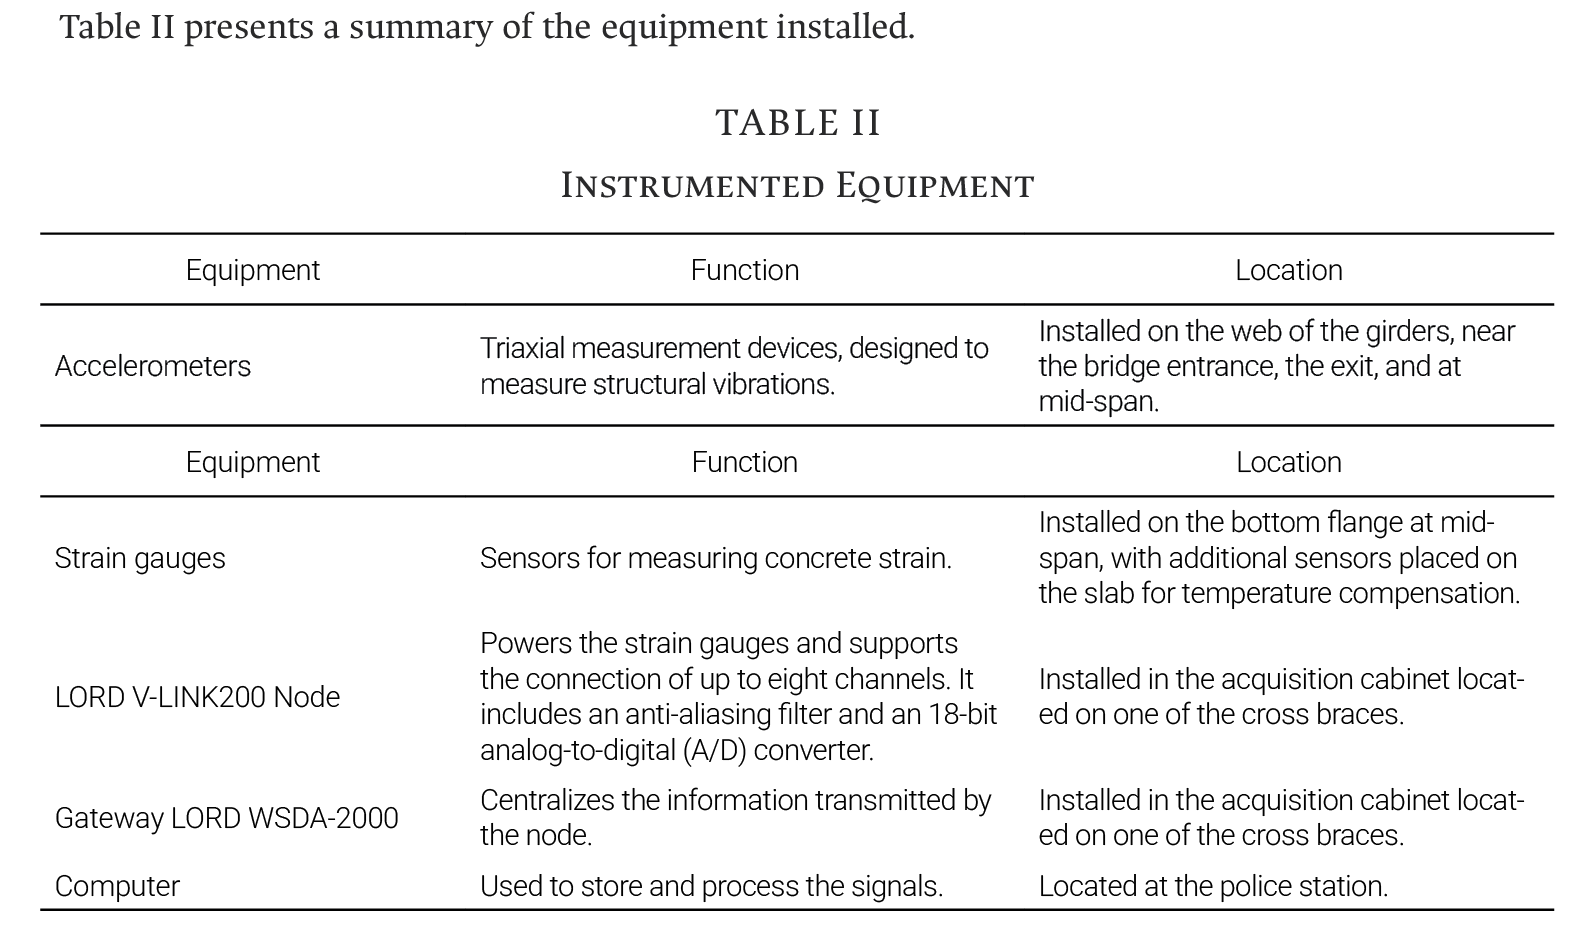
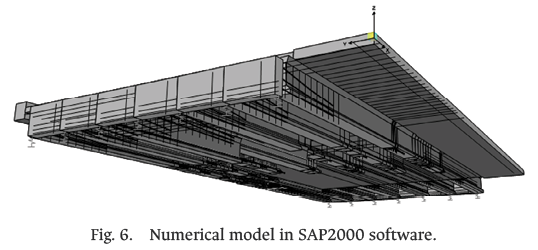
The methodology was evaluated through simulations conducted on a numerical model of the structure, developed using the finite element software SAP2000 and based on the geometric survey, as shown in Fig. 6. The model was constructed using thin-shell elements to represent the beams, diaphragms, and slabs. Springs were assigned at the nodes corresponding to the bottom flange to simulate the behavior of neoprene bearings [22]. Additionally, beam deterioration was incorporated by modeling the cracks identified through visual inspection. The length, thickness, and location of each crack were recorded, and the affected areas were partially removed in the model to represent them accurately. Prestressing cables were also included in the model to account for their structural effects. The cross bracings were represented by a distributed load equivalent to their self-weight, without considering their contribution to the overall stiffness.
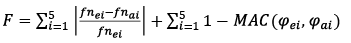
Due to the lack of detailed information on material characterization, the material properties were treated as adjustable parameters during model calibration, based on the results of experimental modal identification [22] and field-measured displacements. Eq. (7) and (8) show the objective functions used for these calibrations, respectively.
 (7)
(7)
 (8)
(8)
Where ƒnei and ƒnai are the i-th experimental and analytical frequencies, respectively, and MAC is a statistical measure that evaluates the agreement between two mode shapes, specifically, the shapes of the experimental modes (φei) and those of the analytical modes (φai), expressing their similarity on a scale from 0 to 1, where 1 indicates perfect correlation, and values near 0 indicate little or no similarity. The equation used for its calculation is presented in (9).
 (9)
(9)
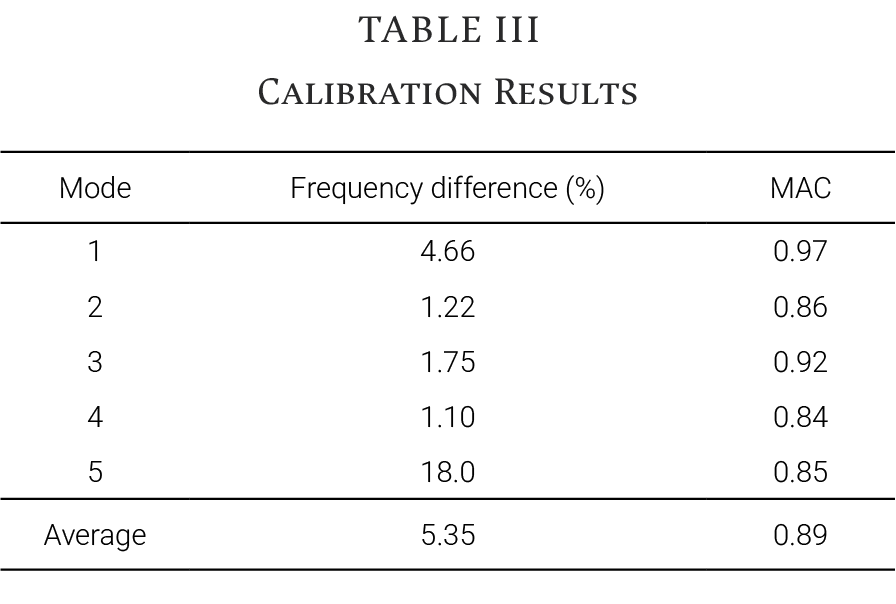
To calibrate the dynamic properties, variables such as material characteristics, elastic modulus, self-weight, and the vertical stiffness of the supports were considered. The results of the calibration are summarized in Table III.
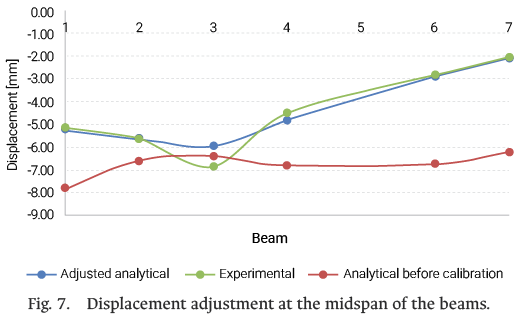
The static adjustment was performed by varying the prestressing force in the beams, resulting in the configuration shown in Fig. 7.
To construct the bridge’s influence surface, numerical simulations were conducted with a vehicle crossing at a speed of 1 m/s along different transverse positions. From these simulations, influence lines (ILs) were generated based on the strain response at the center of the bridge. These lines were then aligned to obtain the influence surfaces corresponding to each beam. Fig. 8 shows the influence surfaces corresponding to Beam 2 and Beam 3, respectively.
Using the calibrated model, various load scenarios were simulated for a two-axle vehicle with a GVW of 170 kN, distributed as 40 kN on axle 1 and 130 kN on axle 2. The simulations considered the vehicle crossing Beam 2, then Beam 4, and finally Beam 5, at speeds of 5 m/s and 15 m/s.
The vehicle parameters were identified using the previously described peak-to-peak method. Using the influence surface as a reference, the axle loads for each load scenario were estimated. Tables IV and V provide a summary of the main simulated scenarios. The results demonstrate that vehicle speed can be estimated with considerable accuracy using the proposed method. This level of precision is crucial, as errors in speed estimation directly affect the accuracy of load identification: the greater the error in estimated speed, the larger the deviation in the calculated load. Additionally, it was observed that axle-based load identification can yield higher percentage errors compared to the GVW, particularly at higher speeds. Nevertheless, the estimation of GVW was highly accurate.
B. Controlled Load Tests
Controlled load tests were conducted to evaluate the loads. Prior to their execution, a load testing protocol was designed, taking into account the location of the structure within the city and traffic conditions. The number of configurations and tests to be performed was determined by considering static, dynamic, and service tests.
In this test, the structure was subjected to a 17.39-t truck with the load distributed across the two axles. A sampling frequency of 32 Hz was used for the strain recordings, and 250 Hz for the acceleration measurements. Three operational load tests were performed to assess the bridge’s response to this type of demand and the frequency at which it is subjected to such loads.
During the dynamic load tests, the fully loaded dump truck traveled along each lane. The tests were conducted during periods selected to minimize traffic disruption as shown in Fig. 9.
C. Identification of vehicle parameters
Acceleration signals showed in Fig. 10 revealed distinct peaks corresponding to axle crossings. The time delay between these peaks, combined with the known travel distance (19 m), yielded an accurate estimation of vehicle speed. Similarly, the interval between the first and second axle peaks provided the axle spacing.
The vehicle was identified with a speed of 1.93 m/s and an axle spacing of 4.44 m, which are very close to the actual values of 1.9 m/s and 4.47 m. This demonstrates that the technique accurately identifies these parameters.
D. Load determination
The vehicle weight was estimated from the global strain response of the bridge, recorded at a frequency of 32 Hz using strain gauges and processed with the algorithm proposed by Yu et al. [19], as shown in Fig. 11. The axle weight estimation is performed using the influence surface corresponding to the vehicle’s transverse position, identified based on the beam exhibiting the maximum response. First, the axle weights are calculated using (5), and then the GVW is determined using (1).
The results presented in Table VI show once again that the percentage differences are higher for individual axle weights than for the GVW. However, these values were very close to the actual values.
- Conclusions
One of the main challenges of B-WIM methodologies is their application in real traffic scenarios, where multiple vehicles travel simultaneously over the structure. This situation generates overlapping signals preventing the accurate identification of the target vehicle. For this reason, in this study, validation was only possible through a single controlled load test. Nevertheless, the results support the conclusion that the applied methodology is viable. Future work will focus on automating the process through tools such as image processing to improve the system’s accuracy and efficiency under more complex and dynamic conditions.
A two-phase adjustment of the structure’s numerical model was proposed. The first phase was based exclusively on modal information, while the second incorporated the results of a static load test. This approach enabled the achievement of reliable results. It is important to highlight that the accuracy of load estimation depends directly on the load-response relationship, using a properly tuned model.
The numerical results confirm that in the process of determining weights, the accuracy of the initial data related to vehicle identification is crucial. In this regard, the vibration sensors used in this process have proven to be portable and accurate devices that, through the peak detection technique employed, enable the estimation of speed and axle spacing with an error margin below 5%.
The results obtained with the proposed methodology demonstrate that vehicular load estimation can be effectively achieved through a vibration- and strain-based system that relies on unit deformations. As a noninvasive and more practical method than commonly used approaches, it simplifies the measurement and implementation process, making it an accessible and efficient alternative for vehicular load estimation.
The application of this methodology to a bridge that does not meet the ideal conditions typically required by B-WIM methodologies, due to its rough deck surface and steep approach slope, presents a significant challenge. However, satisfactory results were obtained, providing a valuable contribution to the field of study.
References
[1] P. Villani, “El puente de Morandi colapsado en el puerto italiano de Génova: dinámica y causas,” presented at Session 30: Bridge Damage Assessment, 26th World Road Congress (PIARC), Abu Dhabi, United Arab Emirates, 2019. [Online]. Available: https://re.public.polimi.it/handle/11311/1102902
[2] S. Prieto, “Publican el informe oficial sobre el colapso del puente Nanfang’ao en Taiwán - Estructurando,” Estructurando, Dec. 15, 2020. [Online]. Available: https://estructurando.net/2020/12/15/informe-oficia-sobre-el-colapso-del-puente-nanfangao-en-taiwan/
[3] El País, “Puente vehicular caído en Yopal, Casanare, colapsó por sobrepeso,” El País, Aug. 23, 2016. [Online]. Available: https://www.elpais.com.co/colombia/puente-vehicular-caido-en-yopal-casanare-colapso-por-sobrepeso.html
[4] RCN Radio, “¿Cuántos puentes se han caído en Colombia?,” RCN Radio, Apr. 18, 2023. [Online]. Available: https://www.rcnradio.com/colombia/puentes-caidos-en-colombia-los-cinco-casos-mas-recordados
[5] P. Héndez, “Fallas de los puentes en Colombia, ¿cuestión de tiempo, monitoreo o apropiación?,” Unal.edu.co, Sep. 01, 2023. [Online]. Available: https://periodico.unal.edu.co/articulos/fallas-de-los-puentes-en-colombia-cuestion-de-tiempo-monitoreo-o-apropiacion (accessed Jan. 09, 2024).
[6] D. S. Cusba, “Estudio de las causas y soluciones estructurales del colapso total o parcial de los puentes vehiculares de Colombia desde 1986 al 2011, y la evaluación de las consecuencias del derrumbamiento de uno de ellos,” Bachelor’s thesis, Pontificia Universidad Javeriana, Bogotá, Colombia, 2011. [Online]. Available: https://repository.javeriana.edu.co/bitstreams/136c63a9-6aac-4a4a-863b-af8f736f7d94/download
[7] G. Badilla Vargas, “Incidencia de las estaciones de pesaje móvil en los factores camión en pavimentos de Costa Rica,” Informe Técnico UI-03-09, Unidad de Investigación en Infraestructura Vial, Laboratorio Nacional de Materiales y Modelos Estructurales, Universidad de Costa Rica, San José, Costa Rica, Oct. 2009. [Online]. Available: https://www.lanamme.ucr.ac.cr/repositorio/handle/50625112500/1179
[8] A. Lansdell, W. Song, and B. Dixon, “Development and testing of a bridge weigh-in-motion method considering nonconstant vehicle speed,” Engineering Structures, vol. 152, pp. 709–726, Dec. 2017, doi: https://doi.org/10.1016/j.engstruct.2017.09.044.
[9] S. Lobo and G. Mora, “¡Puentes que nos hablan! Puentes Inteligentes, tecnología aplicada para la administración de la infraestructura vial,” Moviliblog – Inter-American Development Bank Blog, May 08, 2020. [Online]. Available: https://blogs.iadb.org/transporte/es/puentes-que-nos-hablan-puentes-inteligentes-tecnologia-aplicada-para-la-administracion-de-la-infraestructura-vial/
[10] J. R. Hernández-Jiménez and M. J. Fabela-Gallegos, Diseño y construcción de un prototipo para determinar el peso de vehículos ligeros en movimiento, Mexican Institute of Transportation, Secretariat of Communications and Transportation, Technical Publication PT-247, 2004. [Online]. Available: https://www.imt.mx/archivos/publicaciones/publicaciontecnica/pt247.pdf
[12] J. Kim and J. P. Lynch, “Experimental analysis of vehicle–bridge interaction using a wireless monitoring system and a two-stage system identification technique,” Mechanical Systems and Signal Processing, vol. 28, pp. 3–19, Apr. 2012, doi: https://doi.org/10.1016/j.ymssp.2011.12.008
[13] D. Paul and K. Roy, “Application of bridge weigh-in-motion system in bridge health monitoring: a state-of-the-art review,” Structural Health Monitoring, Art. no. 147592172311544, Mar. 2023, doi: https://doi.org/10.1177/14759217231154431
[14] A. Žnidarič and J. Kalin, “Using bridge weigh-in-motion systems to monitor single-span bridge influence lines,” Journal of Civil Structural Health Monitoring, vol. 10, no. 5, pp. 743–756, Jul. 2020, doi: https://doi.org/10.1007/s13349-020-00407-2
[15] F. Moses, “Weigh-in-Motion System Using Instrumented Bridges,” Transportation Engineering Journal of ASCE, vol. 105, no. 3, pp. 233–249, May 1979, doi: https://doi.org/10.1061/tpejan.0000783.
[16] S. S. Law, T. H. T. Chan, and Q. H. Zeng, “Moving Force Identification: A Time Domain Method,” Journal of Sound and Vibration, vol. 201, no. 1, pp. 1–22, Mar. 1997, doi: https://doi.org/10.1006/jsvi.1996.0774
[17] T. H. T. Chan, S. S. Law, T. H. Yung, and X. R. Yuan, “An interpretive method for moving force identification,” Journal of Sound and Vibration, vol. 219, no. 3,
pp. 503–524, Jan. 1999, doi: https://doi.org/10.1006/jsvi.1998.1904
[18] S. S. Law, Tommy H.T. Chan, and Q. L. Zeng, “Moving Force Identification—A Frequency and Time Domains Analysis,” Journal of Dynamic Systems Measurement and Control-transactions of The Asme, vol. 121, no. 3, pp. 394–401, Sep. 1999, doi: https://doi.org/10.1115/1.2802487
[19] WAVE Project Consortium, Weigh-in-Motion of Axles and Vehicles for Europe: Final Report, RTD Project RO-96-SC-403. European Commission, Brussels, Belgium, 2002.
[20] Y. Yu, C. S. Cai, and L. Deng, “Nothing-on-road bridge weigh-in-motion considering the transverse position of the vehicle,” Structure and Infrastructure Engineering, vol. 14, no. 8, pp. 1108–1122, Nov. 2017, doi: https://doi.org/10.1080/15732479.2017.1401095.
[21] A Žnidarič, I Lavrič, and J. Kalin, “Latest practical developments in the bridge WIM technology,” in Bridge maintenance, safety and management, Jul. 2010, pp. 993–1000, [Online]. Available: doi: https://www.researchgate.net/publication/281551030_Latest_practical_developments_in_the_bridge_WIM_technology
[22] J. Kalin, A. Žnidarič, and I. Lavrič, Practical Implementation of Nothing-on-the-Road Bridge Weigh-in-Motion System. Ljubljana, Slovenia: Slovenian National Building and Civil Engineering Institute (ZAG), 2006.
[23] M. Marín, D. Millán Yusti, S. Castellanos Toro, J. Marulanda Casas, and P. Thomson, “Caracterización de cargas vehiculares en un puente con monitoreo estructural,” in Desarrollo e Innovación en Ingeniería. Colombia, Antioquía: Instituto Antioqueño de Investigación, 2021, pp. 627–640. [Online]. Available: https://dialnet.unirioja.es/servlet/articulo?codigo=8742742
[24] E. MacLeod and K. Arjomandi, “Enhanced Bridge Weigh-in-Motion System Using Hybrid Strain–Acceleration Sensor Data,” Journal of Bridge Engineering, vol. 27, no. 9, Jul. 2022, doi: https://doi.org/10.1061/(asce)be.1943-5592.0001924
[25] E. J. OBrien, M. J. Quilligan, and R. Karoumi, “Calculating an influence line from direct measurements,” Proceedings of the Institution of Civil Engineers - Bridge Engineering, vol. 159, no. 1, pp. 31–34, Mar. 2006, doi: https://doi.org/10.1680/bren.2006.159.1.31
[26] D. Millán, “Metodología para la gestión de la integridad estructural de una red urbana de puentes con actualización en tiempo real,” Doctoral Thesis, Universidad del Valle, Cali, Colombia, 2023.