Development of a Numerical Model to Estimate
the Capacity of Confined Tubular Masonry
Walls, Unreinforced and Reinforced with
Electrowelded Mesh
Balmes Tucto1 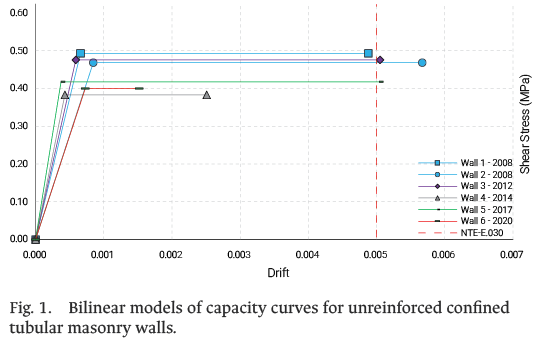 , Luis Quiroz2
1 [email protected], 2 [email protected]
1School of Engineering, San Ignacio de Loyola University, Peru | 2Facultad de Ingeniería,
Universidad de Lima, Perú
Recibido: 8 Mayo 2025 / Publicado: 24 Abril 2026
https://doi.org/10.26439/ciic2025.8664
ABSTRACT. Brick is the predominant material used in dwelling construction in Peru; however, it is used inadequately, without proper technical supervision, resulting in informal buildings. These informal constructions are highly vulnerable, and when combined with Peru’s high seismic hazard, they pose a serious risk of significant human loss during major seismic events. Among these, confined walls made of tubular bricks—also known as confined tubular masonry walls—are the most vulnerable; nevertheless, they are the most common structural walls in informal construction due to their low cost. The vulnerability of confined tubular masonry walls can be reduced through appropriate reinforcement techniques. In this context, a numerical model was calibrated to estimate the capacity of unreinforced and reinforced confined tubular masonry walls with electrowelded wire mesh. The model incorporates the longitudinal and transverse steel of the confining columns, axial load, masonry prism compressive strength, and electrowelded wire mesh. It follows a bilinear behavior and was calibrated using the multiple linear regression method and test results from the National University of Engineering (UNI) and the Pontifical Catholic University of Peru (PUCP). The model achieved a coefficient of multiple determination (R2) of 0.88 for resistance and 0.42 for drift, with corresponding standard errors (SEs) of 0.033 and 0.00073, respectively.
KEYWORDS: Confined tubular masonry walls, tubular brick, electrowelded wire mesh.Thematic axes: Seismic and structural engineering.
- Introduction
In Peru, masonry walls are mainly built using four types of bricks or masonry units: solid industrial bricks, solid handmade bricks, industrial hollow bricks, and tubular bricks. The last three types are subject to restrictions for use as structural walls in highly seismic areas. Specifically, the Peruvian Masonry Standard (NTE-E.070) prohibits the use of industrial hollow bricks and tubular bricks, and in the case of solid handmade bricks, it only allows their use in buildings with a maximum of two stories located in the country’s most seismic areas [1]. The regulatory restrictions are frequently disregarded by property owners or builders. As a result, dwellings constructed with these three types of bricks are commonly found along Peru’s coast and highlands, leading to informal constructions that are highly vulnerable to both major and moderate seismic events.
According to the National Institute of Statistics and Informatics (INEI), 55.8% of dwellings in Peru use brick or concrete block as the predominant construction material [2]. Moreover, a study by the Group for the Analysis of Development (GRADE) concluded that seven out of ten dwellings in the country are informal constructions [3]. The president of the Peruvian Chamber of Construction (CAPECO) has likewise indicated that 70% of dwellings in Lima are informal constructions and that an even higher percentage is observed in other regions of the country [4]. In that regard, a study by the Peruvian–Japanese Center for Seismic Research and Disaster Mitigation (CISMID) reported that 83% of dwellings in emerging areas of Lima are informal constructions. These structures fail to comply with the displacement limits established by the Seismic Resistant Design Standard (NTE-E.030) and the resistance requirements of the Masonry Standard (NTE-E.070), as their walls are made with inadequate bricks [5].
Among the different wall types, those build with tubular bricks—referred to as confined tubular masonry walls—exhibit the lowest load-bearing capacity. However, they are the most widely used in informal construction due to their low cost. Several research have therefore been conducted to demonstrate both the poor performance of confined tubular masonry walls under vertical and horizontal loads and the improved behavior achieved when these walls are reinforced with electrowelded wire mesh. The reinforcement technique using electrowelded wire mesh has been studied under different connection configurations between the mesh and the wall, including walls with the mesh connected to the masonry [6], to the masonry and the vertical confinement elements [7], [8], and to the masonry and all the confinement elements [9], [10].
Peru lies within a region where 80% of the world’s earthquake occur, making it one of the most seismically active countries on the planet [11]. In addition, the predominant use of masonry units or bricks in dwellings—often the result of informal construction practices—further increases seismic vulnerability, as these structures typically employ deficient construction techniques and poor-quality materials, such as the use of tubular bricks instead of solid industrial ones. Hence, it is essential to develop a model for both unreinforced and reinforced confined tubular masonry walls to assess their seismic performance.
Three specific objectives were considered to meet the general objective of developing a numerical model for confined tubular masonry walls. The first is to collect capacity curves for both unreinforced and reinforced confined tubular masonry walls; the second is to transform these capacity curves into bilinear curves; and the third is to calibrate a numerical model using an appropriate statistical regression method. In this study, the dependent variable is the numerical model and the independent variable is the regression method. Finally, the research hypothesis proposes that the multiple linear regression method is appropriate to determine the capacity of both unreinforced and reinforced confined tubular masonry walls with electrowelded wire mesh.
- Background
The background is organized into three sections. The first section presents experimental studies on unreinforced confined tubular masonry walls. The second section discusses experimental studies on reinforced confined tubular masonry walls strengthened with electrowelded wire mesh. This section is further divided into three subsections, which differentiate the types of mesh-to-wall connection and the reinforcement applied on one versus both sides of the wall. The third section reviews three studies that focus on model calibration for confined masonry walls using statistical regression methods and laboratory wall test results.
A. Unreinforced Confined Tubular Masonry Walls
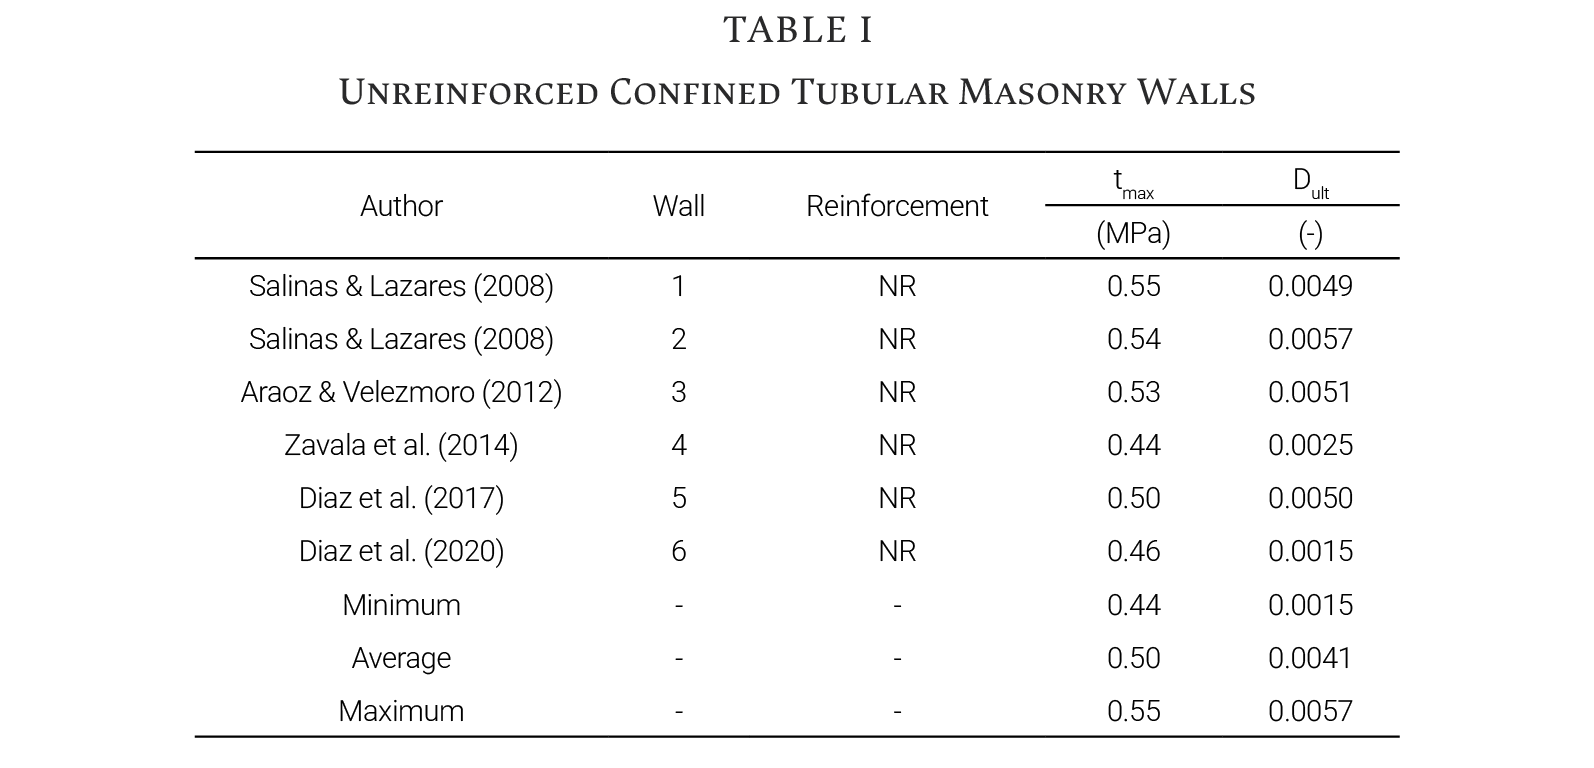
In the design of reinforced concrete structures and metal structures, it is common to adopt foreign design standards. However, this approach is not appropriate for masonry structures, since construction procedures and materials differ markedly from those used in other countries [12]. Accordingly, this section presents national research on unreinforced confined tubular masonry walls. These studies were conducted in the laboratories of the National University of Engineering (UNI) and the Pontifical Catholic University of Peru (PUCP). Table I shows the maximum capacity achieved by each unreinforced wall (NR) in terms of shear stress and drift. The reported shear stress corresponds to the maximum observed value, and the drift corresponds to the ultimate stress or 80% of the maximum observed stress, since beyond this point the wall becomes unstable [13].
Salinas and Lazares [14] were the first to study confined tubular masonry, motivated by the extensive use of tubular brick in the main walls of dwellings in Lima. Their study aimed to understand the behavior of confined tubular masonry walls. Notably, it is the only work that considered walls constructed with both industrial and handmade tubular bricks. Subsequent studies have focused exclusively on walls made of industrial tubular bricks. The findings indicated that the walls built with industrial tubular bricks were more resistant than those with handmade tubular bricks, but exhibited lower displacement capacity.
Araoz and Velezmoro [6], Zavala et al. [15], Diaz et al. [9], and Diaz et al. [10] also studied confined tubular masonry with the same objective and rationale. They additionally analyzed a series of masonry prisms, which presented a key mechanism between the mortar and the tubular brick that significantly increased the diagonal tensile strength. In this context, it was observed that the capacity of walls made of tubular brick is reduced by vertical loads than by horizontal ones. While key mechanisms provide good resistance to horizontal loads, the horizontal tubules of the brick make the wall fragile under vertical loads. Consequently, walls tested under excessive vertical loads showed reduced resistance and displacement capacities.
In Table I, the minimum and maximum resistance values are close to the average. However, in the case of drifts, the minimum value differs considerably from the average. This difference occurs because the ultimate drift is restricted to the point corresponding to 80% of the maximum resistance; if this restriction were ignored, the result would be closer to the average. In Wall 6 test, the wall reached a drift greater than 0.0040, but this value was not considered because the resistance fell below 80% of the maximum. It is worth mentioning that the minimum and average drift values are close to those recommended by Zavala et al. [5], who proposed using a design drift of 0.0017 and an ultimate drift of 0.0037 for confined tubular masonry walls. Moreover, Fig. 1 shows bilinear models of the capacity curves of unreinforced walls listed in the previous table, based on the American Society of Civil Engineers/Structural Engineering Institute (ASCE/SEI) 41-13 methodology [13].
B. Reinforced Confined Tubular Masonry Walls
Similar to the previous section on unreinforced confined tubular masonry walls, this section presents national research on confined tubular masonry walls reinforced with electrowelded wire mesh. These studies were conducted in the laboratories of PUCP and UNI. Table II shows the maximum capacity reached by each reinforced wall in terms of shear stress and drift. The reported shear stress corresponds to the maximum observed value, and the drift corresponds to the ultimate stress or 80% of the maximum observed stress, since the wall becomes unstable beyond this threshold [13].
The reinforcement code R-M-2 denotes a reinforced wall (R) with mesh connected to masonry (M); R-MC-2 corresponds to a reinforced wall (R) with mesh connected to masonry (M) and the confinement columns (C); and R-MCB-2 refers to a reinforced wall (R) with mesh connected to masonry (M) and to all confinement elements (CB) on both sides (2). On the other hand, R-MC-1 corresponds to a reinforced wall (R) with mesh connected to masonry (M) and the confinement columns (C); and R-MCB-1 refers to a reinforced wall (R) with mesh connected to masonry (M) and to all confinement elements (CB) on one side (1). Reinforcements applied on both sides of the walls represent the interior walls, while those applied on one side represent the exterior walls, which are only accessible from one side due to the neighboring buildings.
Araoz and Velezmoro [6] were the first to study confined tubular masonry walls reinforced with electrowelded wire mesh to prevent the collapse of confined tubular masonry dwellings. Their research aimed to improve the performance or behavior of these walls, which are highly vulnerable without reinforcement. It is important to note that in their study, the mesh was connected only to the masonry, since it was only intended to increase resistance. Mamani [7], Diaz et al. [9], Diaz et al. [10], and SENCICO [8] also studied confined tubular masonry walls strengthened with electrowelded wire mesh with the objective of improving their behavior. These studies demonstrated that the type of mesh connection and the number of reinforced sides have a significant influence on the capacity of the reinforced walls, producing a notable change in the resistance and deformation capacity.
The following paragraphs describe the performance of the reinforced walls according to the type of mesh connection.
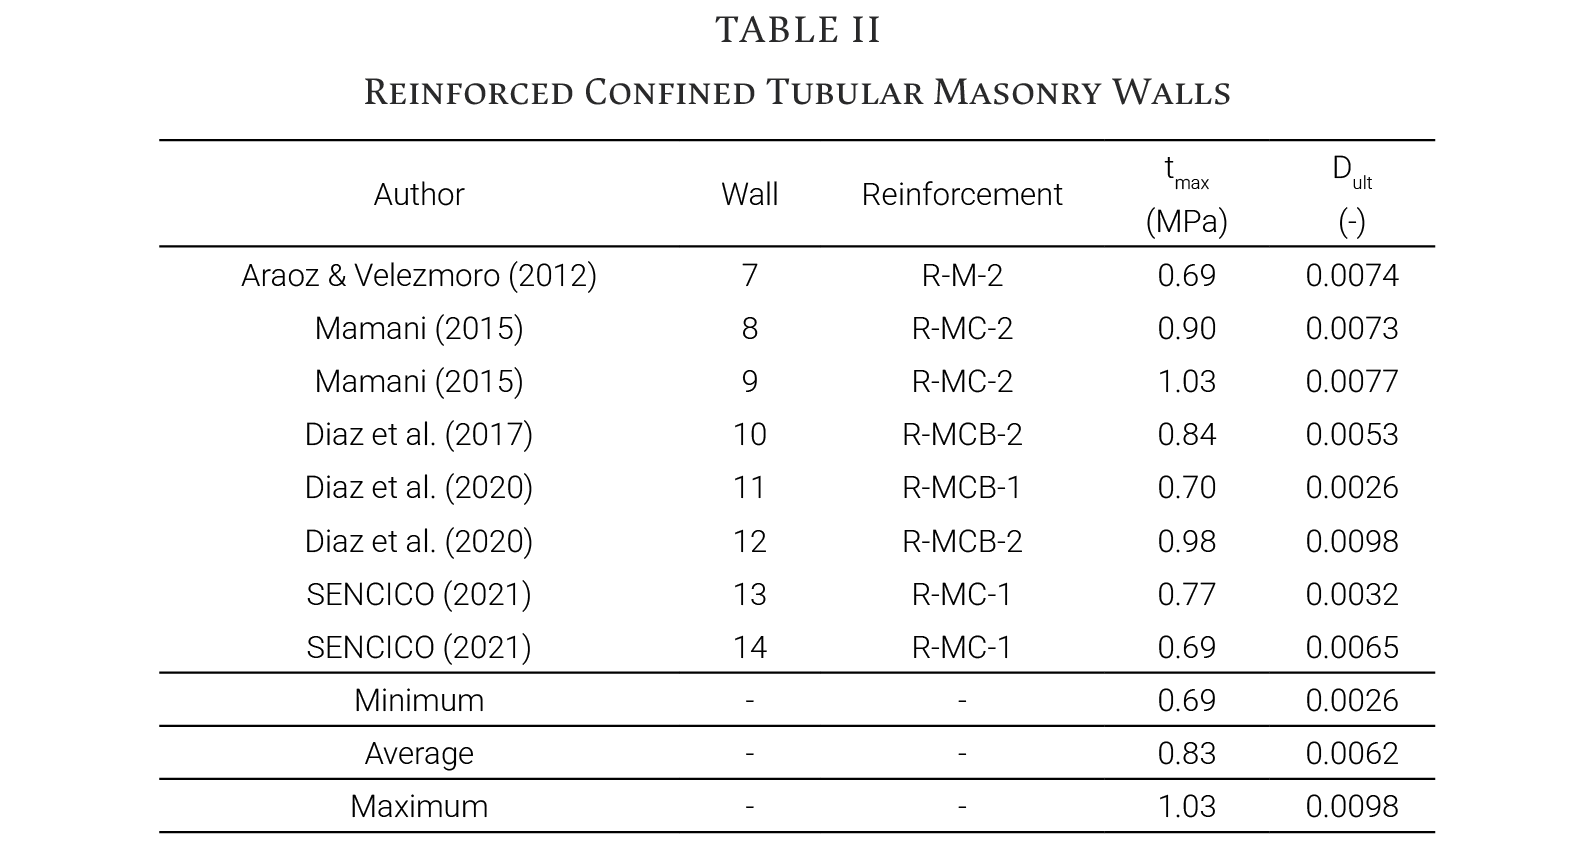
Reinforced confined tubular masonry with mesh connected to masonry (R-M-2). This connection type produces a slight increase in the resistance of confined tubular masonry walls. Table I shows a minimum resistance of 0.44 MPa for unreinforced walls, while Table II shows that Wall 7, reinforced on both sides, reached a resistance of 0.69 MPa, representing a modest 57% increase. No studies have been conducted with the mesh connected only to the masonry on one side of the wall.
Reinforced confined tubular masonry with mesh connected to masonry and confinement columns (R-MC-2, R-MC-1). This connection type produces a significant increase in the resistance of confined tubular masonry walls. Table I shows a minimum resistance of 0.44 MPa for unreinforced walls, while Table II shows that Wall 8, reinforced on both sides, reached a resistance of 0.90 MPa, representing a substantial 105% increase. In the case of reinforcement on one side, Wall 14 reached a resistance of 0.69 MPa, corresponding to a 57% increase.
Reinforced confined tubular masonry with mesh connected to masonry and all confinement elements (R-MCB-2, R-MCB-1). This connection type leads to a significant improvement in both the resistance and drift capacity of confined tubular masonry walls. Table I shows a minimum resistance of 0.44 MPa and a minimum drift of 0.0015 for unreinforced walls, while Table II shows that Wall 10, reinforced on both sides, reached a resistance of 0.84 MPa and a drift of 0.0053, corresponding to increases of 91% and 253%, respectively. In the case of one-sided reinforcement on one side, Wall 11 achieved a resistance of 0.70 MPa and a drift of 0.0026, resulting in increases of 60% and 73%, respectively.
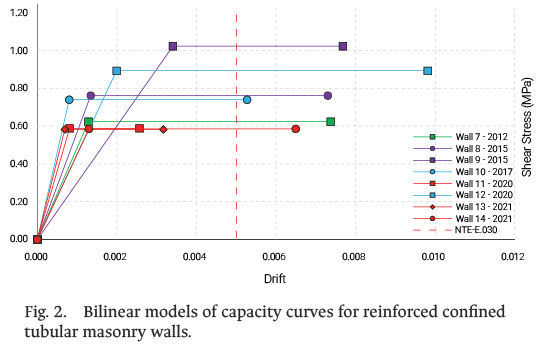
Finally, it is important to note that the comparison between unreinforced and reinforced walls is only referential, as they were tested under different conditions; i.e., they differ in the amount of steel in the confinement columns, masonry resistance, axial load, and the amount of mesh used. Accordingly, when reinforced walls on both sides are tested under similar conditions, those mesh connected to both the masonry and all confinement elements are expected to exhibit the greatest resistance and deformation capacity, while those with mesh connected only to the masonry should show the least. However, this trend is not reflected in the results presented in Table II, where Walls 7, 8, and 9 demonstrate greater deformation capacity than Wall 10. The average drift value is close to that recommended by Diaz [16], who recommends considering a drift of 0.0050 for walls reinforced with electrowelded wire mesh. Fig. 2 shows bilinear models of the capacity curves for the reinforced walls listed in the previous table.
C. Calibrated Masonry Models
For model calibration using statistical regression methods, it is first necessary to identify the dependent and independent variables. In this case, the dependent variables are already defined as the shear resistance and deformation of confined tubular masonry walls. Therefore, it remains to identify the independent variables and the appropriate regression method to adequately estimate the resistance and deformation of these walls. In this regard, three studies are presented below, each proposing models to determine wall capacity based on specific independent variables.
Sugano et al. [17] calibrated a confined masonry model using multiple linear regression. The model’s maximum resistance (tmax) is expressed as a function of the amount of longitudinal and transverse steel reinforcement in the confinement columns (Pt.sy, Pwe.swe), the axial load (s0), and the compressive strength of the masonry prism (Fm). The maximum drift (Dmax) is expressed as a function of the wall (h/l), as evidenced in Equations (1) and (2).
Cardenas et al. [18] also calibrated a confined masonry model using multiple linear regression. The model’s ultimate resistance (tu) is based on the wall aspect ratio (h/l), the amount of longitudinal steel resistance in the confinement columns (Pt.sy), the axial load (s0), and the compressive strength of the masonry prism (Fm), as evidenced in Equation (3). The ultimate drift (Du) was not calibrated.
Diaz et al. [19] also calibrated a confined masonry model using multiple linear regression. However, this study was more comprehensive, since it calibrated the cracking, yielding, maximum, and ultimate resistance. The model’s resistance (tmax) is based on the amount of longitudinal and transverse steel resistance in the confinement columns (Pt.sy, Pwe.swe), the axial load (s0), and the compressive strength of the masonry prism (Fm), as evidenced in Equation (4). The corresponding drifts of the model (D) are fixed values for each resistance state.
Overall, the capacity of confined masonry walls is mainly a function on the wall aspect ratio, the amount of longitudinal and transversal steel reinforcement in the confinement columns, the axial load, and the compressive strength of the masonry prism. Moreover, multiple linear regression is an appropriate statistical method for determining the capacity of confined masonry walls.
- Methodology
The research aims to create a model capable of determining the capacity of unreinforced and reinforced tubular masonry walls strengthened with electrowelded wire mesh. To achieve this, the independent variables must first be identified to form the dimensionless parameters. Subsequently, the most appropriate regression method is selected to perform the calibration of the confined tubular masonry wall model. The background information presented above is essential for identifying the independent variables and appropriate dimensionless parameters, as well as for selecting the most suitable regression method for model calibration.
A. Dependent and Independent Variables
The dependent variables in this study are the resistance and deformation capacity, as the objective is to determine the capacity of confined tubular masonry walls. The independent variables were previously identified by the authors cited in the background section. Accordingly, in Equations (5) and (6), the dependent variables are expressed as functions of the independent variables—i.e., the strength and drift as a function of the amount of longitudinal (Pt = As / t.l) and transverse (Pwe = Awe / t.s) steel of the columns; the yield resistance of the longitudinal (sy) and transverse (swy) steel of the columns, the axial load (s0); the compressive strength of the masonry prism (Fm); and the wall height (h) and effective length (l = 0.9L). Here, As is the area of the longitudinal steel of the columns, Awe is the area of the transversal steel of columns, t is the wall thickness, s is the spacing of the transversal steel of columns, and L is the wall length.
B. Dimensionless Parameters
The dimensionless parameters were also identified by the authors cited in the background section. In Equations (7) and (8), the dimensionless parameters are formed from the independent variables described above. It is worth noting that new dimensionless parameters can be formed using the Buckingham π theorem.
C. Regression Methods
The models were calibrated using various regression methods, such as simple linear regression, simple nonlinear regression, multiple linear regression, multiple nonlinear regression, and polynomial regression. Among these, the simple linear regression method is the least complex since it relates a dependent variable to an independent variable (two variables) in a linear way. Conversely, the multiple nonlinear regression method is the most complex since it relates a dependent variable to several independent variables (more than two variables) in a nonlinear way [20].
Given that more than two independent variables were defined in the previous section, only the multiple linear regression, multiple nonlinear regression, and polynomial regression methods are applicable. In addition, the reviewed literature indicates that the multiple linear regression method provides an adequate representation of masonry walls. Consequently, this method was selected for the present calibration. The equations used to determine the regression parameters (β0, β1, β2, and β3), the standard error (SE), the coefficient of multiple determination (R2), and the multiple correlation coefficient (R) are presented below. Equation (9) shows the expression of the multiple linear regression method. Here, y is the independent variable; xi (x1, x2, x3, ...+xm) are the independent variables; βi (β1, β2, β3, …, βm) are the regression parameters; and m is the number of independent variables.
Regression parameters (βi). The regression parameters can be determined using the least squares method or, alternatively, through a matrix approach, as shown in Equation (10). Here, y is the independent variable; xi (x1, x2, x3, ..., xm) are the independent variables; βi (β1, β2, β3, …, βm) are the regression parameters; m is the number of independent variables; n is the number of equations; {A} is the vector of dependent variable values; {B} is the matrix of independent variable values; and {X} is the vector of the coefficients.
SE. The SE measures the dispersion, i.e., the variation between the calculated and experimental results [20]. In Equation (11), y represents the experimental values, y^ are calculated values, e is the error between the experimental and calculated value, n is the number of groups in the sample, and p is the number of estimated parameters.
R2 and R. R2 represents the proportion of the total variation of the dependent variable that depends on the other variables involved in the regression equation [20]. This coefficient changes between zero and unity, with values closer to unity indicating a good fit. Here, Se is the SE, Sy2 is the variance of the dependent variable, y- is the mean of the independent variable, y^ is the calculated values, and n is the number of groups in the sample. R2 and R can be determined using Equation 12.
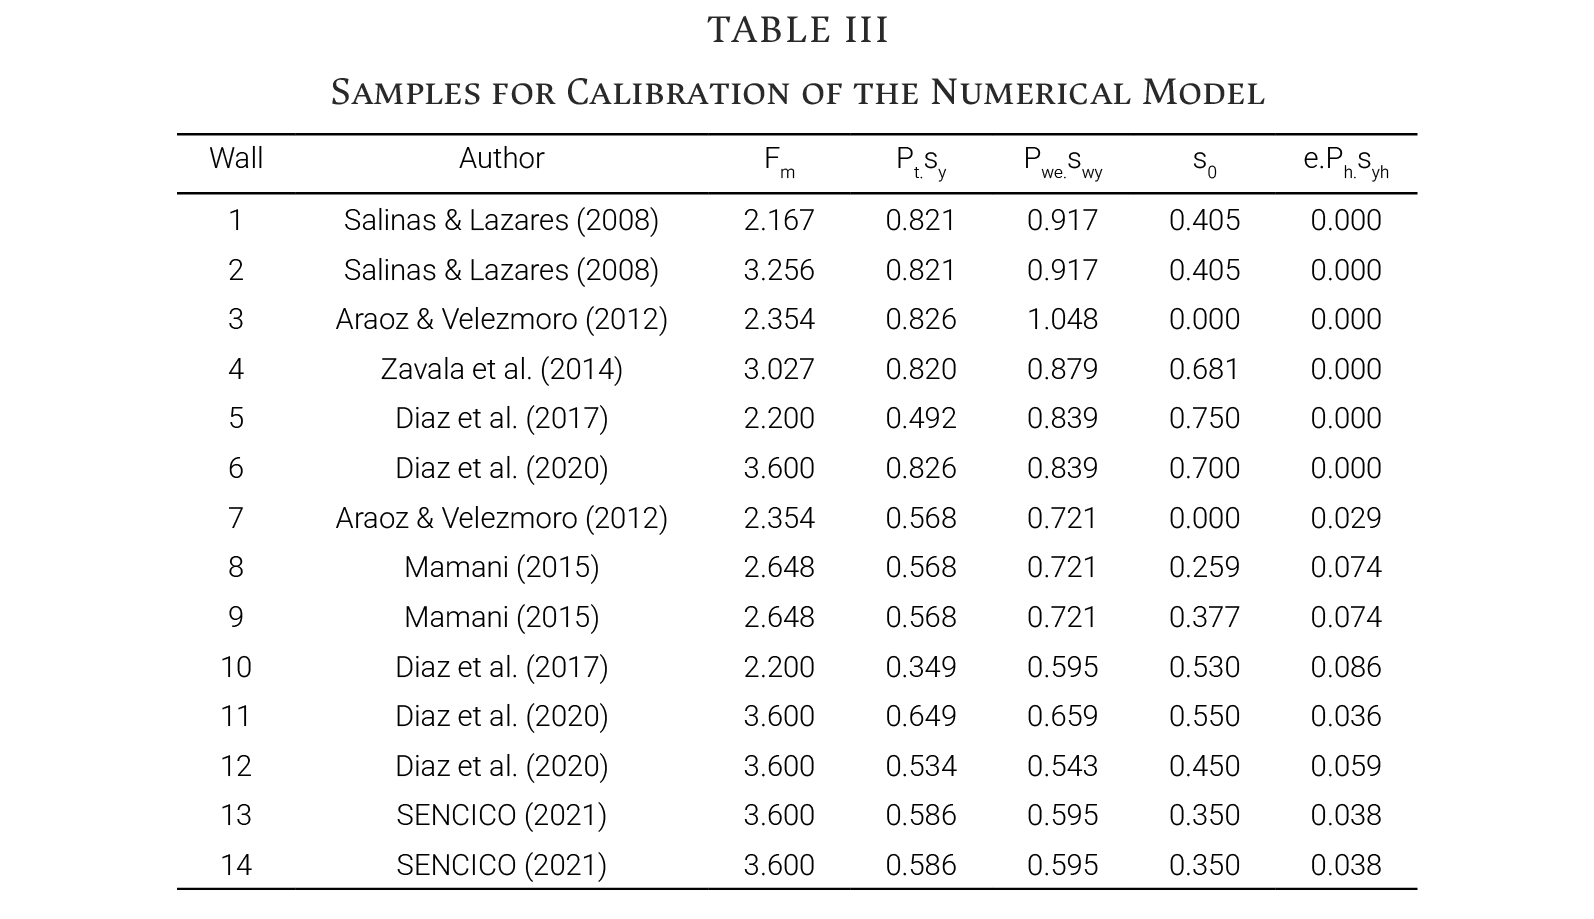
Table III presents all the samples used in the model calibration, expressed in megapascals (MPa). Cross-validation was not applied due to the limited number of samples. Likewise, regularization was not implemented to exclude irrelevant independent variables, as the independent variables identified in the research by Sugano et al. [17] and Diaz et al. [19]—already validated in previous research—were considered.
- Results and Discussion
The proposed model is bilinear, and only the point where the ascending and horizontal lines intersect is calibrated—i.e., only the yield point is calibrated. The ultimate point maintains the same resistance, while the drift is a fixed value obtained from the studies presented in the background section. This section is organized into three parts. The first presents the results and discussion of the dimensionless parameters considered in the calibration of the unreinforced and reinforced confined tubular masonry wall model. The second focuses on the yield resistance calibration, and the third discusses the yield drift calibration.
A. Dimensionless Parameters of Confined Tubular Masonry Walls
The dimensionless parameters used to determine the capacity of unreinforced confined masonry walls are the same as those proposed by Sugano et al. [17] and Diaz et al. [19]. However, to consider the reinforcement, an additional dimensionless parameter must be introduced to represent the electrowelded wire mesh. Accordingly, a new parameter is incorporated, similar to that used for the steel of the confinement columns, but including an additional variable representing the type of connection of the electrowelded wire mesh to the wall. This variable represents the efficiency factor e of the mesh, which reflects whether the mesh is connected only to the masonry, to both the masonry and the confinement columns, or to the masonry and all the confinement elements. Equations (13) and (14) present the relationships between the dependent and independent variables for unreinforced and reinforced confined tubular masonry walls with electrowelded wire mesh.
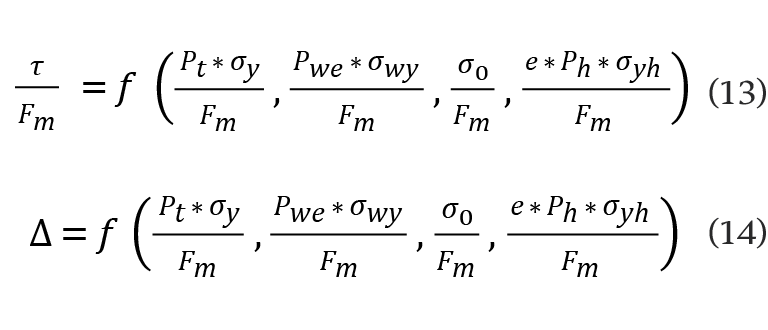
According to Diaz [21], the resistance of walls in which the mesh is connected only to the masonry is reduced to 45%, while that of the walls where the mesh is connected to the masonry and confinement columns is reduced to 65%, compared to walls where the mesh is connected to both the masonry and all confinement elements. Thus, the efficiency factor e is defined as follows: e is equal to unity when the mesh is connected to the masonry and all confinement elements (e = 1.00); e is equal to 0.65 when the mesh is connected to the masonry and confinement columns (e = 0.65); and e is equal to 0.45 when the mesh is connected only to the masonry (e = 0.45).
B. Calibration of Yield Resistance
The bilinear model was calibrated using 14 tests conducted at UNI and PUCP. Six tests correspond to unreinforced walls and eight to reinforced tubular masonry walls confined with electrowelded wire mesh featuring different connection types between the mesh and the wall. The behavior curves of the 14 walls were converted to bilinear using the methodology proposed by ASCE/SEI 41-13 [13]. Furthermore, the statistical method of multiple linear regression was employed to calibrate this model, since it is widely used to calibrate the confined masonry wall models, as evidenced in the literature reviewed.
Table IV presents the dependent dimensionless parameter and the four independent dimensionless parameters used for model calibration. The first and last independent dimensionless parameters were raised to a number equal to 0.7, which improved the fit between the calculated and experimental values. Table V summarizes the regression parameters, SE, R², and R obtained for the yield resistance model of unreinforced and reinforced confined tubular masonry walls with electrowelded wire mesh. Finally, Equation (15) presents the calibrated model for calculating the yield resistance, incorporating the regression parameters and the dimensionless parameters that represent the longitudinal and transverse steel of the confinement columns, the axial load, the compressive strength of the masonry prism, and the electrowelded wire mesh.
Table V shows that R2 is close to unity, indicating a strong fit between the observed and predicted values, in accordance with the confined masonry models proposed by Sugano et al. [17], Cardenas et al. [18], and Diaz et al. [19].
The dimensionless parameters in Equation (15) are consistent with those used in previous studies, except for the last one that represents the contribution of the electrowelded wire mesh to the wall resistance. In the equation, the factor e refers to the mesh efficiency, Ph to the ratio (Ph = Ah / t.S), and σyh to the yield resistance of the electrowelded wire mesh. Ah represents the steel area of the mesh, t the wall thickness, and S the mesh spacing.
C. Calibration of Yield Drift
This section presents the results of the yield drift calibration for the unreinforced and reinforced confined tubular masonry wall model. Table VI lists the dependent and independent parameters used for calibration through the multiple linear regression method.
Table VII shows that R2 is not close to unity, indicating that the fit between experimental and calculated values is not strong. However, it is considered an acceptable value, since it is closer to unity than those reported by other authors. Sugano et al. [17] obtained values of R = 0.4300 and R2 = 0.1849, both of which are very far from unity. It is important to note that the fit was not satisfactory because a large number of independent variables were considered, while only a limited number of samples or experimental data were available for model calibration. In addition, the confined walls constructed with tubular bricks exhibited erratic behavior under vertical loads, since they suddenly collapsed under significant vertical loads without developing their full deformation capacity.
Equation (16) presents the model used to determine the yield drift. The dimensionless parameters are the same as those used in the yield resistance model; only the regression parameters change.
Accordingly, Fig. 3 illustrates the bilinear model, which is constructed based on three points. The first point corresponds to the origin, which is not determined; the second is the yield point, determined with Equations (15) and (16); and the third is the last point, constructed using Equation (15) for resistance and drift recommendations by Zavala et al. [5] and Diaz [16], i.e., a drift of 0.0037 for unreinforced walls and 0.0050 for walls reinforced with electrowelded wire mesh.
The numerical model applies to confined tubular masonry walls with characteristics similar to those of the walls used in the calibration process. The applicable range is as follows: 2.16 < Fm < 3.60; 0.34 < Pt.sy < 3.83; 0.54 < Pwe.swy < 1.05; 0.0 <s0 < 0.75; and 0.00 < e.Ph.syh < 0.09. The range of values can be verified in Table III.
- Conclusions
The multiple linear regression method proved suitable for calibrating confined tubular masonry wall models unreinforced and reinforced with electrowelded wire mesh. The resistance and drift of these walls depend on the longitudinal and transverse steel reinforcement in the confinement columns, the axial load, the compressive strength of the masonry prism, and the amount of the electrowelded wire mesh. The efficiency variable accounts for the type of connection used for the electrowelded wire mesh in the confined tubular masonry wall, which has a significant impact on the wall capacity. This study and its numerical model are limited by the fact that only isolated single-panel walls with aspect ratios close to unity were analyzed, and cross-validation was not applied due to the small sample size. Therefore, it is recommended future tests to be conducted on confined tubular masonry walls with multiple panels and aspect ratios different from unity to obtain a bilinear model with a wider and more reliable application range.
References
[1] Servicio Nacional de Capacitación para la Industria de la Construcción (SENCICO), “Norma Técnica E.070 Albañilería,” Ministerio de Vivienda, Construcción y Saneamiento, Lima, Peru, 2006. [Online]. Available: http://blog.pucp.edu.pe/blog/wp-content/uploads/sites/82/2008/01/Norma-E-070-MV-2006.pdf
[2] Instituto Nacional de Estadística e Informática (INEI), “Censos Nacionales 2017: XII de Población, VII de Vivienda y III de Comunidades Indígenas,” INEI, Lima, Peru, 2018. [Online]. Available: https://censo2017.inei.gob.pe/resultados-definitivos-de-los-censos-nacionales-2017/
[3] F. Arias Schreiber, “7 de cada 10 viviendas en el Perú son autoconstruidas: los limeños tardan 16 años en levantar el primer piso”, Infobae, Jun. 2, 2024. [Online]. Available: https://www.infobae.com/peru/2024/06/03/7-de-cada-10-viviendas-en-el-peru-son-autoconstruidas-los-limenos-tardan-16-anos-en-levantar-el-primer-piso/
[4] W. Angulo, “Capeco: El 70% de viviendas en Lima son informales y vulnerables a un terremoto,” RPP, Sep. 26, 2017. [Online]. Available: https://rpp.pe/economia/economia/capeco-el-70-de-viviendas-en-lima-son-construidas-sin-normas-tecnicas-noticia-1078934?ref=rpp
[5] C. Zavala, M. Diaz, E. Flores, and L. Cardenas, “Damage limit states for confined masonry walls based on experimental test,” Journal of Disaster Research, vol. 29, no. 2, pp. 135–141, 2019, doi http://dx.doi.org/10.21754/tecnia.v29i2.715
[6] T. A. Araoz Escobedo and J. P. Velezmoro Girón, “Reforzamiento de viviendas existentes construidas con muros confinados hechos con ladrillos pandereta – segunda etapa,” Undergraduate thesis, Pontificia Universidad Católica del Perú, Lima, Peru, 2012. [Online]. Available: http://hdl.handle.net/20.500.12404/1203
[7] P. Mamani Quina, “Comportamiento mecánico de muros de albañilería tubular confinada reforzados con malla electrosoldada ante cargas sísmicas y gravitacionales,” Master’s thesis, Pontificia Universidad Católica del Perú, Lima, Peru, 2015. [Online]. Available: http://hdl.handle.net/20.500.12404/6324
[8] Servicio Nacional de Capacitación para la Industria de la Construcción (SENCICO), “Ensayos estructurales de especímenes de albañilería reforzados con malla electrosoldada por una sola cara,” Ministerio de Vivienda, Construcción y Saneamiento, Lima, Peru, 2021. [Online]. Available: https://www.gob.pe/institucion/sencico/informes-publicaciones/2290691-ensayos-estructurales-de-especimenes-de-albanileria-reforzados-con-malla-electrosoldada-por-una-sola-cara
[9] M. Diaz, C. Zavala, J. Gallardo, and L. Lavado, “Experimental study of non-engineered confined masonry walls retrofitted with wire mesh and cement-sand mortar,” in Proceedings of the 16th World Conference on Earthquake Engineering (16WCEE), Santiago, Chile, 2017. [Online]. Available: https://www.wcee.nicee.org/wcee/article/16WCEE/WCEE2017-2950.pdf
[10] M. Diaz, C. Zavala, and E. Flores, “Structural assessment of confined masonry retrofitting under multi-seismic scenarios in Metropolitan Lima Area,” in Proceedings of the 17th World Conference on Earthquake Engineering (17WCEE), Sendai, Japan, 2020. [Online]. Available: https://www.cismid.uni.edu.pe/wp-content/uploads/2021/10/3b-0076.pdf
[11] H. Tavera, “Evaluación del peligro asociado a los sismos y efectos secundarios en Perú,” Instituto Geofísico del Perú, Lima, Peru, 2014. [Online]. Available: https://portal.indeci.gob.pe/wp-content/uploads/2019/01/fil20140926131431.pdf
[12] Á. F. San Batolomé, D. Quiun, and W. Silva, Diseño y construcción de estructuras sismorresistentes de albañilería, 2nd ed. Lima, Peru: Fondo Editorial de la Pontificia Universidad Católica del Perú, 2018. [Online]. Available: https://hdl.handle.net/20.500.14657/170319
[13] American Society of Civil Engineers, Seismic Evaluation and Retrofit of Existing Buildings, Reston, VA, USA: ASCE, 2014. [Online]. Available: https://doi.org/10.1061/9780784412855
[14] R. Salinas and F. Lazares, “Seismic performance of confined masonry buildings with tubular bricks in developing areas,” in Proceedings of the 14th World Conference on Earthquake Engineering (14WCEE), Beijing, China, 2008. [Online]. Available: https://www.iitk.ac.in/nicee/wcee/article/14_05-04-0003.PDF
[15] C. Zavala, L. Lavado, J. Taira, J., L. Cardenas, and M. Diaz, “Comparison of behaviors of non-engineered masonry tubular block walls and solid engineered walls,” Journal of Disaster Research, vol. 9, no. 6, pp. 1025–1021, 2014. [Online]. Available: https://pdfs.semanticscholar.org/7cfc/ad6b25b0b7659e17366b9810da545f1faf5b.pdf
[16] C. M. Diaz, “Modelo elastoplástico para la estimación de la capacidad por corte de muros de ladrillo pandereta,” Undergraduate thesis, Pontificia Universidad Católica del Perú, Lima, Peru, 2021. [Online]. Available: http://hdl.handle.net/20.500.12404/19466
[17] S. Sugano, T. Saito, C. Zavala, and L. Cardenas, L, “Strength and deformation of confined brick masonry walls subjected to lateral forces – Review of existing test data in Japan and Peru,” Journal of Disaster Research, vol. 9, no. 6, pp. 984–992, 2014. [Online]. Available: https://doi.org/10.20965/jdr.2014.p0916
[18] L. Cardenas, R. Reyna, L. Estacio, and C. Zavala, “Implementation of database of masonry walls test – Review of existing test data in Peru,” Journal of Disaster Research, vol. 9, no. 6, pp. 993–1000, 2014. [Online]. Available: https://doi.org/10.20965/jdr.2014.p0993
[19] M. Diaz, C. Zavala, E. Flores, and L. Cardenas, “Desarrollo de modelos analíticos para muros de mampostería confinada basados en resultados experimentales en la ciudad de Lima,” TECNIA, vol. 29, no. 2, pp. 23–29, 2019. [Online]. Available: https://doi.org/10.21754/tecnia.v29i2.711
[20] M. Villon, Hidrología estadística. Lima, Peru: Ediciones Villón, 2016.
[21] Servicio Nacional de Capacitación para la Industria de la Construcción (SENCICO), “Propuesta técnica de reforzamiento sísmico de muros de albañilería confinada informal, a los que se tiene acceso por una sola cara,” Ministerio de Vivienda, Construcción y Saneamiento, Lima, Peru, 2022. [Online]. Available: https://www.gob.pe/institucion/sencico/informes-publicaciones/2718022-propuesta-tecnica-de-reforzamiento-sismico-de-muros-de-albanileria-confinada-informal-a-los-que-se-tiene-acceso-por-una-sola-cara